HP Intelligent Management Center v5.1 SP1 Application Manager Administrator Guide
Manuals
Brands
HP Manuals
Computer Accessories
HP IMC Application Manager additional 100-monitor License
341
342
343
344
345
346
347
348
349
350
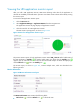
340
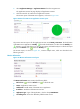
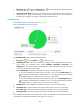
graph contains max
imum
, minimum
, an
d ave
ra
g
e
r
es
po
ns
e t
im
e
va
lu
es.
Pla
c
e
th
e c
urs
or o
v
er
a spot
in
the
c
urv
e t
o v
i
ew t
h
e r
esp
on
se tim
e va
lues
at th
e sp
ec
i
fic
ti
m
e
p
oin
t.
1
...
...
345
346
347
348
349
...
...
355