
HP Intelligent Management Center v5.1 SP1 Application Manager Administrator Guide


346
Page Size
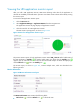
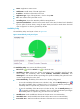
APM examines the size of the requested Web page, and records changes of the page size in a trend
graph, as shown in Figure 268.
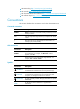
Figure 268 Page Size area layout
The Page Size area contains the following fields:
• Last 1 Hour icon —By default, the page size trend graph shows changes of the Web page size
over the last one hour. To change the report period, click the Last 1 Hour icon on the upper
right of the graph, and then select an icon from the list. Available options include Last 6 Hours
, Today , Yesterday , This Week , This Month , and This Year .
• Refresh icon —Click the Refresh icon to refresh the area.
• Web page size trend graph—Shows changes of the Web page size over the last one hour in a
line chart. Place the cursor over a spot in the curve to view the Web page size at the specific time
point.
• Attribute/Value—Monitor index name and data.
Page Size—Size of the requested Web page in the last APM polling period.
Rate of Change—Change rate of the requested Web page size in the last APM polling
period. The change rate is a percentage of the page size change in the last two requests to
the size of the last requested page. The value is positive while the page size increases, and is
negative while the page size is reduced.
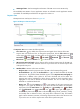
• History icon —Click the History icon to view statistics of the history Web page size
change rates in a line graph. By default, the graph shows the last hour statistics. To change the
report period, click the Last 6 Hours icon , Today icon , Yesterday icon , This Week icon
, This Month icon , or This Year icon on the upper right of the graph as needed.
Hourly data and today's data is collected every polling interval, yesterday's, weekly, and monthly
data is collected in hours, and yearly data is collected in days. The statistics graph contains
maximum, minimum, and average change rates. Place the cursor over a spot in the curve to view
the change rates at the specific time point.