
HP Intelligent Management Center v5.1 SP1 Application Manager Administrator Guide


46
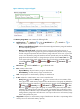
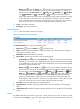
Set Threshold icon —Click the Set Threshold icon for a monitor index to set alarm
thresholds for the physical or virtual memory usage. The usage ratio is highlighted in yellow
when it reaches the level-1 threshold, and is highlighted in red when it reaches the level-2
threshold. You can use either the global thresholds or user-defined thresholds. For information
about configuring alarm thresholds, see "xxx."
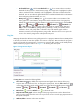
History icon —Click the History icon for a monitor index to view statistics of the
history physical or virtual memory usage ratio trend for Windows XP in a line graph. By
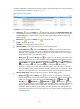
default, the graph shows the last hour statistics. To change the report period, click the Last 6
Hours icon , Today icon , Yesterday icon , This Week icon , This Month icon
, or This Year icon on the upper right of the graph as needed. Hourly data and
today's data is collected every polling interval, yesterday's, weekly, and monthly data is
collected in hours, and yearly data is collected in days. The statistics graph contains
maximum, minimum, and average memory usage ratios. Place the cursor over a spot in the
curve to view memory usage ratios at the specific time point.
Ping Test
APM pings the Windows XP host at every polling interval. In a ping test, APM sends out an ICMP packet
to the host, and sends at most three packets. If it receives a response, APM considers the ping test a
success and records the response time. If it receives no response after sending out all ICMP packets,
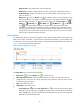
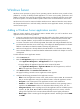
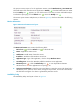
APM considers the ping test a failure. See Figure 17 for the Ping Test area layout.
Figure 17 Ping Test area layout
The Ping Test area contains the following fields:
• Last 1 Hour icon —By default, the response time trend graph shows changes of the ping
response time over the last one hour. To change the report period, click the Last 1 Hour icon
on the upper right of the graph, and then select an icon from the list. Available options include Last
6 Hours , Today , Yesterday , This Week , This Month , and This Year .
• Refresh icon —Click the Refresh icon to refresh the area.
• Response time trend graph—Shows changes of the ping response time over the selected time
period in a line graph. Place the cursor over a spot on the curve to view the ping response time at
the specific time point.
• Attribute/Value—Monitor index name and data.