
HP Intelligent Management Center v5.1 SP1 Application Manager Administrator Guide


57
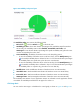
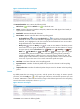
Figure 27 Memory usage trend graph
The Memory Usage Ratio area contains the following fields:
• Dashboard icon /Trend icon —Click the Dashboard icon or Trend icon to
display the area in a dashboard or trend graph.
Memory usage dashboard graph—Shows the transient physical memory usage of Windows
Server in the last polling period.
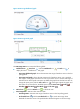
Memory usage trend graph—Shows the memory usage trend of Windows Server over a
specified time range in a line graph. The green line represents the physical memory and the
orange line represents the virtual memory. Place the cursor over a spot in the curve to view the
memory usage of Windows Server at the specific time point. By default, the graph shows the
last hour data. To change the report period, click the Last 1 Hour icon on the upper right
of the graph, and then select an icon from the list. Available options include Last 6 Hours
, Today , Yesterday , This Week , This Month , and This Year . Click the
icon name of a monitor index to display or hide the monitor index in the trend graph.
• Refresh icon —Click the Refresh icon to refresh the area.
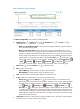
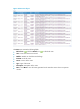
• Item—Monitor index name.
Physical Memory—Physical memory usage on Windows Server.
Virtual Memory—Virtual memory usage on Windows Server.
• Total—Total physical or virtual memory capacity on Windows Server.
• In Use—Physical or virtual memory size in use on Windows Server.
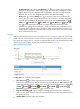
History icon —Click the History icon for a monitor index to view statistics of the
history physical or virtual memory usage trend for Windows Server in a line graph. By default,
the graph shows the last hour statistics. To change the report period, click the Last 6 Hours
icon , Today icon , Yesterday icon , This Week icon , This Month icon , or
This Year icon on the upper right of the graph as needed. Hourly data and today's data
is collected every polling interval, yesterday's, weekly, and monthly data is collected in hours,
and yearly data is collected in days. The statistics graph contains maximum, minimum, and
average memory usage ratios. Place the cursor over a spot in the curve to view memory usage
ratios at the specific time point.
• Usage Ratio—Physical or virtual memory usage of Windows Server. The value is a percentage of
the memory size in use to the total memory capacity.