
HP Intelligent Management Center v5.1 SP1 Application Manager Administrator Guide


60
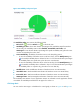
icon , This Month icon , or This Year icon on the upper right of the graph as
needed. Hourly data and today's data is collected every polling interval, yesterday's, weekly,
and monthly data is collected in hours, and yearly data is collected in days. The statistics
graph contains maximum, minimum, and average disk space usage ratios. Place the cursor
over a spot in the curve to view disk space usage ratios at the specific time point.
• In Use—Used space of the disk.
• Free Space—Free space of the disk.
Service
By default, APM does not monitor any service, and the service list is empty. To monitor specific services,
click the Config icon on the upper right of the area, and select the services you want to monitor.
APM starts to collect state information of the selected services in the next polling interval. The Service
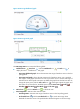
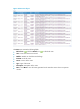
area layout is shown in Figure 30.
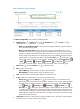
Figure 30 Service area layout
The Service area contains the following fields:
• Config icon —Click the Config icon . APM quickly populates the Application Instance List
with all detected services running on the Windows Server host. Select the services you want to
monitor and click OK. APM starts to collect state information about the selected services in the next
polling interval.
• Refresh icon —Click the Refresh icon to refresh the area.
• Service Name—Original name of the service.
• Display Name—Service name or alias displayed on the Windows service console. For example,
on the Windows service console, the DHCP client service uses the alias DHCP Client Service rather
than the original name Dhcp. Typically, the display name identifies a service more clearly.
• State—State of the service in the last polling interval.
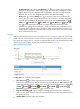
Network Interface
The Network Interface area layout is shown in Figure 31.