
HP Intelligent Management Center v5.1 SP1 Application Manager Administrator Guide


61
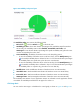
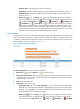
Figure 31 Network Interface area layout
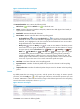
The Network Interface area contains the following fields:
• Refresh icon —Click the Refresh icon to refresh the area.
• Name—Name of the network interface card (NIC). APM monitors both physical and virtual (or
logical) network interface cards.
• Bandwidth—Maximum bandwidth of the NIC.
• Receive Rate—Receive rate of the NIC in the last polling period.
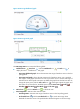
Set Threshold icon —Click the Set Threshold icon for a NIC to set receive rate alarm
thresholds for it. The receive rate of the NIC is highlighted in yellow when it reaches the level-1
threshold, and is highlighted in red when it reaches the level-2 threshold. You can use either
the global thresholds or user-defined thresholds.
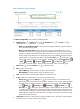
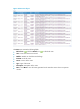
History icon —Click the History icon for a NIC to view statistics of the history receive
rate trend for it in a line graph. By default, the graph shows the last hour statistics. To change
the report period, click the Last 6 Hours icon , Today icon , Yesterday icon , This
Week icon , This Month icon , or This Year icon on the upper right of the graph
as needed. Hourly data and today's data is collected every polling interval, yesterday's,
weekly, and monthly data is collected in hours, and yearly data is collected in days. The
statistics graph contains maximum, minimum, and average interface receive rates. Place the
cursor over a spot in the curve to view receive rates at the specific time point.
• Send Rate—Send rate of the NIC in the last polling period.
• Input Packet Loss—Number of inbound packets lost per second on the NIC in the last polling
period.
• Output Packet Loss—Number of outbound packets lost per second on the NIC in the last polling
period.
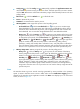
Process
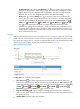
By default, APM does not monitor any process, and the process list is empty. To monitor specific
processes, click the Config icon on the upper right of the area, and select the processes you want
to monitor. APM starts to collect CPU and memory usages of the selected processes in the next polling
interval. The Process area layout is shown in Figure 32.
Figure 32 Process area layout
The Process area contains the following fields: