
HP Intelligent Management Center v5.1 SP1 Application Manager Administrator Guide


74
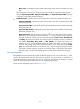
Blue curve—Indicate the trend of system load average (system load/15 minutes) in the past
hour.
Move the pointer to the curve to view the system load average of a specified sampling point.
Click the System Load/Min, System Load/5 Min, and System load/15 Min to display
or hide the corresponding monitored indexes.
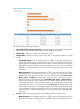
• Attribute/Value—Displays the monitored indexes and its value. The monitored indexes are:
System Load/Min—Indicate the system load average of the last one minute before APM
starts polling the host.
System Load/5 Min—Indicate the system load average of the last five minutes before APM
starts polling the host.
System Load/15 Min—Indicate the system load average of the last fifteen minutes before
APM starts polling the host.
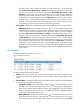
History Record—Click the History Record icon to view the system load trend of the
AIX system in a past time period, which includes the last 1 hour, last 6 hours, today, yesterday,
this week, this month, and this year. If you select the time period Last 1 hour, Last 6 hours,
or Today, the system load indexes are measured in unit of a polling interval; if you select the
time period Yesterday, This week, or This month, the system load indexes are
measured in hours, and the diagram displays the system load trends, and the maximum,
minimize, and average values of the system load indexes; if you select the time period This
year, the system load indexes are measured in days, and the diagram displays the system
load trends, and the maximum, minimize, and average values of the system load indexes.
Move the pointer over the each sampling point to view the system load for the time being.
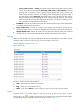
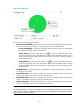
File system usage ratio
Being different from the Windows file system, the AIX file system has only one root directory (/), which
contains all sub-directories and files. Each physical partitions or logical volume is mounted as a
sub-directory through a mount point, and you can read/write data from/to a partitions or logical
volume by reading/writing the data from/to the corresponding sub-directory.
The File System Usage Ratio pane is shown in Figure 42.