
HP Intelligent Management Center v5.1 SP1 Application Manager Administrator Guide


76
hour, last 6 hours, today, yesterday, this week, this month, and this year. If you select the time
period Last 1 hour, Last 6 hours, or Today, the used storage space index is measured in
unit of a polling interval; if you select the time period Yesterday, This week, or This
month, the used storage space index is measured in hours, and the diagram displays the
used storage space trend, and the maximum, minimize, and average values of the used
storage space index; if you select the time period This year, the used storage space index is
measured in days, and the diagram displays the used storage space trend, and the maximum,
minimize, and average values of the used storage space index. Move the pointer over the
each sampling point to view the used storage space for the time being.
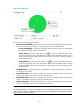
• Free Space—Indicate the available storage space of the specified partition or logical volume.
History Record—Click the History Record icon to view the available storage space
trend of the specified partition or logical volume in a past time period, which includes the last
1 hour, last 6 hours, today, yesterday, this week, this month, and this year. If you select the
time period Last 1 hour, Last 6 hours, or Today, the available storage space index is
measured in unit of a polling interval; if you select the time period Yesterday, This week,
or This month, the available storage space index is measured in hours, and the diagram
displays the available storage space trends, and the maximum, minimize, and average values
of the available storage space index; if you select the time period This year, the available
storage space index is measured in days, and the diagram displays the available storage
space trend, and the maximum, minimize, and average values of the available storage space
index. Move the pointer over the each sampling point to view the available storage space for
the time being.
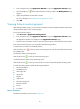
Network interface
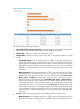
The Network Interface pane is shown in Figure 43.
Figure 43 Network interface
This pane contains the following information:
• Name—Indicate the network card identities of the AIX system. The network cards that can be
monitored by APM include physical network cards and virtual network cards (logical network
card).
• Receive Rate—Indicate the packet receiving rate of the monitored network card when APM polls
the host that the AIX resides for the last time.
Threshold setting—Click the threshold setting icon to set the threshold of packet
receiving rate for the monitored network card. The packet receiving rate is highlighted in
yellow if the conditions of Level-1 threshold are met, and is highlighted in red if the conditions
of Level-2 threshold are met. You can set a user-defined threshold or a global threshold to
control alarms of the packet receiving rate.
History Record—Click the History Record icon to view the packet receiving rate trend
of the monitored network card in a past time period, which includes the last 1 hour, last 6
hours, today, yesterday, this week, this month, and this year. If you select the time period Last