
HP Intelligent Management Center v5.1 SP1 Application Manager Administrator Guide


77
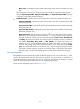
1 hour, Last 6 hours, or Today, the packet receiving rate is measured in unit of a polling
interval; if you select the time period Yesterday, This week, or This month, the packet
receiving rate is measured in hours, and the diagram displays the packet receiving rate
trends, and the maximum, minimize, and average values of the packet receiving rate index; if
you select the time period This year, the packet receiving rate is measured in days, and the
diagram displays the packet receiving rate trend, and the maximum, minimize, and average
values of the packet receiving rate index. Move the pointer over the each sampling point to
view the packet receiving rate for the time being.
• Send Rate—Indicate the packet sending rate of the monitored network card when APM polls the
host that the AIX resides for the last time.
• Input Packet Loss—Indicate the number of lost packets that should be received by the
monitored network card per second when APM polls the host that the AIX resides for the last time.
• Output Packet Loss—Indicate the number of lost packets that should be sent by the monitored
network card per second when APM polls the host that the AIX resides for the last time.
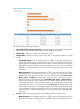
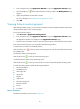
Error log
APM can check the AIX error logs when polling the AIX system, and displays the error logs in the AIX
monitoring report. In the Error Log pane, you can view the latest 10 error logs.
The Error Log pane is shown in Figure 44.
Figure 44 Error log
This pane contains the following information:
• Time—Indicate the time when the error occurs.
• Log—Indicate the content of the error log.
• More—Click the link More to open a window to view more error logs in the AIX system.
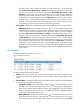
Process
Generally, there is no process displays in the process pane. To monitor the process, click the
Configuration icon to configure the processes to be monitored. The monitored processes and the
corresponding index data displays in the Process pane, as shown in Figure 45.