
HP Intelligent Management Center v5.1 SP1 Application Manager Administrator Guide

86
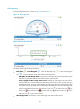
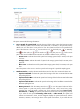
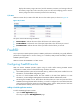
Figure 52 Usage ratio trend
This pane contains the following information:
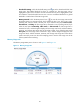
• Dial Plate /Trend Diagram —Click the Dial Plate icon or the Trend Diagram
icon to select a display mode of the Solaris Memory usage ratio.
Dial Plate of Memory Usage Ratio—Display the memory usage ratio of the Solaris
system when APM polls the host that Solaris resides for the last time.
Curve graph of Memory Usage ratio trend—Display the memory usage ratio trend of
the Solaris system in a past time period, which includes the usage ratios of physical memory
(Green line) and swap memory (Orange line). Move the pointer over the curve to view the
usage ratio of a specified time point. Click the Usage Ratio or Swap Usage Ratio to
display or hide the corresponding monitored indexes. The curve graph displays the memory
usage ratio trend of the Solaris system in the past one hour by default. You can also select a
time period to view the memory usage ratio trend in the specified time period. Click the Last 1
hour icon , the Last 6 hours icon , the Today icon , the Yesterday icon , the This
week icon , the This month icon , or the This year icon to select a time period.
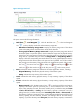
• Item—Indicate the memory usage ratio indexes for the Solaris application monitor, including:
Physical Memory—Indicate the physical memory of the Solaris system.
Swap—Indicate the swap memory of the Solaris system
• Total—Indicate the total memory (physical memory or swap memory) capacity of the Solaris
system.
• In Use—Indicate the used memory (physical memory or swap memory) capacity of the Solaris
system.
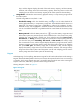
History Record—Click the History Record icon to view the trend of the used memory
capacity of the Solaris system in a past time period, which includes the last 1 hour, last 6
hours, today, yesterday, this week, this month, and this year. If you select the time period Last
1 hour, Last 6 hours, or Today, the used memory capacity is measured in unit of a
polling interval; if you select the time period Yesterday, This week, or This month, the
used memory capacity is measured in hours, and the diagram displays the trend of the used
memory capacity, and the maximum, minimize, and average value of the used memory
capacity; if you select the time period This year, the used memory capacity is measured in