
HP Intelligent Management Center v5.2 Application Performance Manager Administrator Guide

12
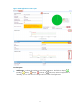
Figure 5 Root cause analysis
Analyze the information of nodes in yellow, orange and red to identify the potential root causes.
APM does not provide the root cause analysis for applications whose availability status is
Unavailable, Unreachable, or Unmanaged. For more information about availability and health
status, see "3 Monitor management."
Refresh icon—Click the Refresh icon to refresh the entire monitoring report page or the data in
a specific area. The Refresh icon located next to the Health Status icon will disappear for a few
seconds each time it is clicked to prevent frequent refreshing of the whole page.
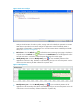
Weekly History icon—Click the Weekly History icon to view availability statistics of the
application in the last 7 days. The data is collected hourly and you can move the pointer over the
chart to view the summary of data collected for a specific hour.
Figure 6 Weekly History
Monthly History icon—Click the Monthly History icon to view availability statistics of the
application in the last 30 days. The data is collected daily and you can move the pointer over a cell
of the chart to view the summary of data collected for a specific day.