
HP Intelligent Management Center v5.2 Application Performance Manager Administrator Guide

469
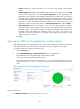
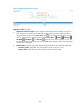
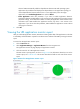
Figure 393 Application Traffic area layout
Application Traffic area fields:
Application Traffic trend graph—shows changes of inbound and outbound traffic over the last 1
hour. The green curve shows the inbound traffic and the orange shows the outbound traffic. To
change the report period, click the Last 1 Hour icon on the upper right of the graph, and then
select an icon from the list. Available options include Last 6 Hours , Today , Yesterday ,
This Week , This Month , and This Year . Hover the cursor over a spot on the curve to view
the application traffic at the specific time point. Click Rx or Tx to display or hide the corresponding
monitor index in the graph.
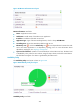
Attribute/Value—Monitor index name and data that was obtained when APM last polled SFTP.
Last Hour's Traffic—Total traffic sent and received by SFTP over the last 1 hour.
Today's Traffic—Total traffic sent and received by SFTP since 00:00 today.