
HP Intelligent Management Center v5.2 Application Performance Manager Administrator Guide

61
Application Traffic
APM collects traffic statistics for the Windows operating system based on the IP address of the Windows
host. The Application Traffic area layout is as shown in Figure 20.
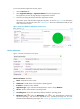
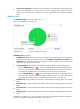
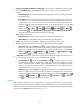
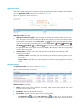
Figure 20 Application Traffic area layout
Application Traffic area fields:
Application Traffic trend graph—Shows changes of inbound and outbound traffic over the last 1
hour. The green curve shows the inbound traffic and the orange curve shows the outbound traffic.
To change the report period, click the Last 1 Hour icon on the upper right of the graph, and then
select an icon from the list. Available options include Last 6 Hours , Today , Yesterday ,
This Week , This Month , and This Year . Hover the cursor over a spot on the curve to view
the application traffic at the specific time point. Click Rx or Tx to display or hide the corresponding
monitor index in the graph.
Attribute/Value—Monitor index name and data that was obtained when APM last polled
Exchange Server 2003.
Last Hour's Traffic—Total traffic sent and received by the Windows operating system over the
last 1 hour.
Today's Traffic—Total traffic sent and received by the Windows operating system since 00:00
today.
Network Interface
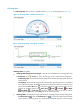
The Network Interface area layout is shown in Figure 21.
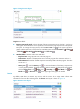
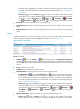
Figure 21 Network Interface area layout
Network Interface area fields:
Name—Name of the network interface card (NIC). APM monitors both physical and virtual
(logical) network interface cards.
Bandwidth—Maximum bandwidth of the NIC.
Receive Rate—Receive rate of the NIC in the last polling period.
Set Threshold icon —Click the Set Threshold icon for a NIC to set receive rate alarm
thresholds for it. The receive rate of the NIC is highlighted in orange when it reaches the level-1