
HP Intelligent Management Center v5.1 SP1 Application Manager Administrator Guide


301
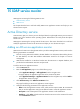
History icon —Click the History icon to view the statistics of the history of the ntds.dit
file size in a line graph. By default, the graph shows the last hour statistics. To change the
report period, click the Last 6 Hours icon , Today icon , Yesterday icon , This Week
icon , This Month icon , or This Year icon on the upper right of the graph as
needed. Hourly data and today's data is collected every polling interval, yesterday's, weekly,
and monthly data is collected in hours, and yearly data is collected in days. The statistics
graph contains maximum, minimum, and average file sizes. Place the cursor over a spot in the
curve to view the file size at the specific time point.
NTFRS Process
The NTFRS process refers to the File Replication Service of AD. It is used for file synchronization among
multiple domain controllers (DCs) deployed with AD, ensuring global synchronization of domain
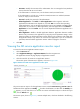
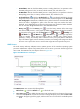
accounts and user configuration files. The NTFRS Process area layout is shown in Figure 235.
Figure 235 NTFRS Process area layout
The NTFRS Process area contains the following fields:
• Refresh icon —Click the Refresh icon to refresh the area.
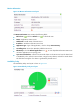
• Last 1 Hour icon —By default, the CPU usage ratio trend graph shows changes of CPU usage
ratio of the NTFRS process over the last one hour. To change the report period, click the Last 1 Hour
icon on the upper right of the graph, and then select an icon from the list. Available options
include Last 6 Hours , Today , Yesterday , This Week , This Month , and This
Year .
• CPU usage ratio trend graph—Shows changes of CPU usage ratio of the NTFRS process over the
last one hour in a line chart. Place the cursor over a spot in the curve to view the CPU usage ratio
at the specific time point.
• Attribute/Value—Monitor index name and data.
CPU Usage Ratio—CPU usage ratio of the NTFRS process in the last APM polling period.
Handles—Total number of handles opened by the NTFRS process in the last APM polling
period.