
HP Intelligent Management Center v5.2 Application Performance Manager Administrator Guide
10
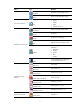
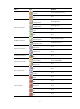
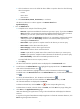
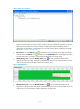
8. In the detection result list, click Add to Monitor of the application you want to monitor, and then set
the parameters of the application monitor.
Application monitor configuration varies with application types. Detailed configuration procedures will
be described in subsequent chapters.
Different entries in the detection result list might have the same application type or port number. For
example, the AIX application can use both TCP 22 (through SSH) and TCP 21 (through Telnet), and both
AIX and Solaris applications can use TCP 22.
File, directory, and SAP cannot be detected through auto-discovery and you must manually add file
monitor and directory monitor.
Viewing monitoring reports
After adding an application monitor to the monitoring list, APM collects and analyzes the monitored
application indexes, and displays the index and performance data in a monitoring report.
To view the monitoring report:
1. Click the Resource tab.
2. Select Application Management > Application Monitor from the navigation tree.
All application monitors are displayed on the Application Monitor page.
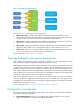
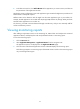
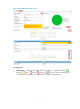
3. Click the name of the desired application monitor and APM displays the monitoring report.
The following example is a monitoring report of the DNS monitor. Fields on the monitoring report
vary with the application types.