
HP Intelligent Management Center v5.2 Application Performance Manager Administrator Guide

186
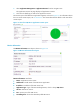
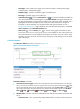
Memory Grants Outstanding—Number of processes that were permitted to use the workspace
memory.
History icon —Click the History icon to view the history graph of the memory usage
trend. Hover the cursor over a spot on the curve to view the memory usage at the specific time
point. Authorized users can view memory usage statistics over the last 1 hour, last 6 hours,
today, yesterday, this week, this month, and this year by clicking the corresponding icons on the
upper right of the graph.
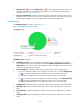
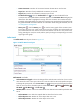
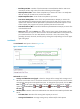
Buffer Management
The Buffer Management area layout is shown in Figure 135.
Figure 135 Buffer Management area layout
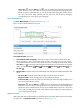
Buffer Management area fields:
Buffer Hit Ratio trend graph—Shows the buffer hit ratio trend of the SQL Server over the last 1 hour
in a line chart. Hover the cursor over a spot on the curve to view the buffer hit ratio of SQL Server
at the specific time point. To change the report period, click the Last 1 Hour icon on the upper
right of the graph, and then select an icon from the list. Available options include Last 6 Hours
, Today , Yesterday , This Week , This Month , and This Year .
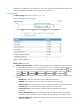
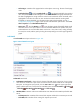
Attribute/Value—Monitor index name and data that was obtained when APM last polled the SQL
Server.
Buffer Hit Ratio—How often the required pages have been found in the buffer pool without
reading from the disk.
Page Lookups/Min—Number of requests to search for pages in the buffer pool per minute.
Page Reads/Min—Number of database pages that were read from the disk per minute.
Page Writes/Min—Number of database pages that were written to the disk per minute.