
HP Intelligent Management Center v5.2 Application Performance Manager Administrator Guide

190
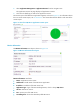
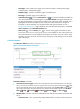
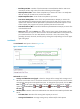
Lock Timeouts/sec—Number of the lock requests that timed out per second.
Number of Deadlocks/sec—Number of the lock requests that resulted in deadlocks per second.
Average Wait Time—Average waiting time for each lock request.
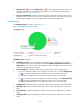
Set Threshold icon —Click the Set Threshold icon to set alarm thresholds for lock
statistics. The specified alarm thresholds appear on the Lock Details trend graph as dotted lines.
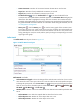
The data is highlighted in orange when the deadlocks reach the level-1 threshold, and is
highlighted in red when the deadlocks reach the level-2 threshold. Use the global thresholds or
custom thresholds. For information about setting the thresholds, see see "5 Configuration
management."
History icon —Click the History icon to view the history graph of the lock statistics trend.
Hover the cursor over a spot on the curve to view lock statistics at the specific time point.
Authorized users can view lock statistics over the last 1 hour, last 6 hours, today, yesterday, this
week, this month, and this year by clicking the corresponding icons on the upper right of the
graph.
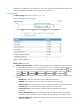
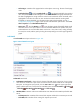
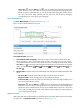
SQL Statistics
The SQL Statistics area layout is shown in Figure 139.
Figure 139 SQL Statistics area layout
SQL Statistics area fields:
SQL Statistics trend graph—Shows the changes of batch requests, SQL compilations, and SQL
recompilations per minute of the SQL Server over the last 1 hour in a line chart. Hover the cursor
over a spot on the curve to view the changes of the index of SQL Server at the specific time point.
To change the report period, click the Last 1 Hour icon on the upper right of the graph, and then
select an icon from the list. Available options include Last 6 Hours , Today , Yesterday ,
This Week , This Month , and This Year .
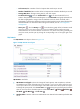
Attribute/Value—Monitor index name and data that was obtained when APM last polled the SQL
Server.