
HP Intelligent Management Center v5.2 Application Performance Manager Administrator Guide

194
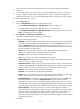
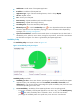
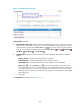
Figure 144 Database Details area layout
Database Details area fields:
Database—Name of the running database in the SQL server when APM last polled the SQL server.
"_Total" indicates whole statistic for all databases.
Size—Disk space for the database.
Transactions—Number of transactions that the database started per minute.
Active Transactions—Number of active transactions of the database.
Log File—Disk space for the database log files.
Log Files Used—Size of used log files in the database.
Log Files Usage Ratio—Usage ratio of the log files in the database. Log Files Usage Ratio = Log Files
Used/Log Files *100%.
Log Writes—Times of writing the log to the log file per minute.
Log Write Waits—Number of the logs that were waiting to be written to the log files.
Log Write Wait Time—Calculated waiting time before the log was written to the log file.
Set Threshold icon —Click the Set Threshold icon to set alarm thresholds for the log file
usage ratio. The data is highlighted in orange when the log file usage ratio reaches the level-1
threshold, and is highlighted in red when the deadlocks reach the level-2 threshold. Use the global
thresholds or custom thresholds. For information about setting the thresholds, see "5 Configuration
management."
More—Click More to view all database details.
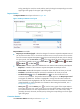
MySQL
MySQL is an open source DBMS that directly impacts the service performance. so APM supports the
monitor function to MySQL.
APM can monitor MySQL 5.x.
Adding a MySQL application monitor
APM monitors the MySQL through the server port (3306 by default). When you add the application
monitors for MySQL, follow these guidelines:
Add MySQL hosts to the IMC Platform so APM can obtain and display network connections of the
hosts and their access devices in the application topology. For more information about adding hosts
to the IMC Platform, see HP IMC Base Platform Administrator Guide.