
HP Intelligent Management Center v5.2 Application Performance Manager Administrator Guide

13
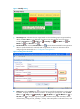
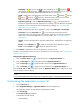
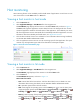
Figure 7 Monthly History
Time Range icon—Indicates the time range based on which the data graph was generated. By
default, the Last 1 Hour icon is displayed. Click the icon to select another icon from the list,
including Last 6 Hours icon , Today icon , Yesterday icon , This Week icon , This
Month icon , and This Year icon .
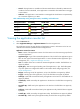
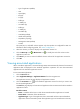
Set Threshold icon—Click the Set Threshold icon to set the alarm thresholds for the application.
When a specified threshold is reached, APM will generate an alarm. For information about
configuring alarm thresholds, see "5 Configuration management."
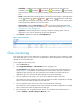
Figure 8 Setting alarm thresholds
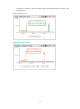
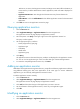
History icon—Click the History icon to view the history trend for the application in a line graph.
By default, the graph shows the last hour statistics. To change the report period, click the Last 6
Hours icon , Today icon , Yesterday icon , This Week icon , This Month icon , or
This Year icon on the upper right of the graph as needed. Hourly data and today's data is
collected every polling interval, yesterday's, weekly, and monthly data is collected in hours, and