
HP Intelligent Management Center v5.2 Application Performance Manager Administrator Guide

245
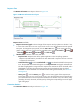
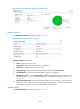
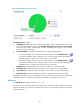
Application Traffic trend graph—Shows changes of inbound and outbound traffic over the last 1
hour. The green curve shows the inbound traffic and the orange curve shows the outbound traffic.
To change the report period, click the Last 1 Hour icon on the upper right of the graph, and then
select an icon from the list. Available options include Last 6 Hours , Today , Yesterday ,
This Week , This Month , and This Year . Hover the cursor over a spot on the curve to view
the application traffic at the specific time point. Click Rx or Tx to display or hide the corresponding
monitor index in the graph.
Attribute/Value—Monitor index name and data that was obtained when APM last polled Sybase.
Last Hour's Traffic—Total traffic sent and received by Sybase over the last 1 hour.
Today's Traffic—Total traffic sent and received by Sybase since 00:00 today.
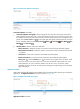
Database Details
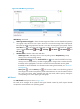
The Database Details area layout is shown in Figure 197.
Figure 197 Database Details area layout
Database Details area fields:
Name—Name of the database the Sybase accessed when APM last polled Sybase.
Total Size—Total size of the disk space assigned to the database.
In Use—Used disk space.
In Use (%)—Ratio of used disk space to total disk space.
Creator—User account that created the database.
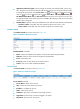
Process Details
The Process Details area layout is shown in Figure 198.
Figure 198 Process Details area layout
Process Details area fields:
Process Name—Name of the process.
Host—Name of the host where the process is.
IP address—IP address of the host.
Status—Status of the process.
Command—Type of the command that was being executed.
Login Name—Name of the account that logged in to Sybase.
Physical IO—Physical IO for the process.