
HP Intelligent Management Center v5.2 Application Performance Manager Administrator Guide

301
lines. The data is highlighted in yellow when it reaches the level-1 threshold, and is highlighted
in red when it reaches the level-2 threshold. Use the global thresholds or self-defined thresholds.
For information about setting the thresholds, see "Threshold Management."
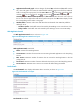
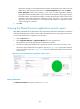
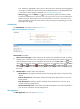
History icon —Click the History icon to view the history graph of the memory usage
trend of the GlassFish server. Hover the cursor over a spot on the curve to view the data at the
specific time point. Authorized users can view the statistics over the last 1 hour, last 6 hours,
today, yesterday, this week, this month, and this year by clicking the corresponding icons on the
upper right of the graph.
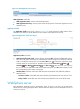
Thread Details
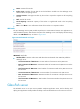
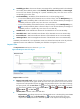
The Thread Details area layout is shown in Figure 250.
Figure 250 Thread Details area layout
Thread Details area fields:
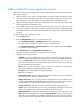
Thread count trend graph—Shows changes of the thread count and daemon thread count of the
GlassFish server over the last 1 hour. The green curve shows the thread count and the orange curve
shows the daemon thread count. To change the report period, click the Last 1 Hour icon on the
upper right of the graph, and then select an icon from the list. Available options include Last 6
Hours , Today , Yesterday , This Week , This Month , and This Year . Hover the
cursor over a spot on the curve to view the thread count and daemon thread count at the specific
time point.
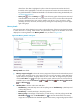
Attribute/Value—Monitor index name and data.
Thread Count—Total number of threads used for processing HTTP requests in the last polling
interval.
Daemon Thread Count—Total number of daemon threads of the GlassFish server in the last
polling interval.
Peak Thread Count—Maximum number of threads of the GlassFish server since the server
started until the last polling interval.
Total Started Thread Count—Total number of threads the GlassFish server had created and run
since the server started until the last polling interval.
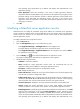
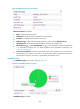
Web Application
The Web Application area is as shown in Figure 251.