
HP Intelligent Management Center v5.2 Application Performance Manager Administrator Guide


309
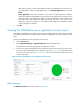
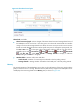
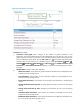
Figure 257 Thread Pool area layout
Thread Pool area fields:
Thread count trend graph—Shows changes of the active thread count and average thread count of
the WebSphere server over the last 1 hour. The green curve shows the active thread count and the
orange curve shows the average thread count. Hover the cursor over a spot on the curve to view the
thread count and daemon thread count at the specific time point. To change the report period, click
the Last 1 Hour icon on the upper right of the graph, and then select an icon from the list.
Available options include Last 6 Hours , Today , Yesterday , This Week , This Month
, and This Year . Click Active Threads or Average Threads to display or hide the
corresponding monitor index in the graph.
Attribute/Value—Monitor index name and data.
Active Threads—Number of concurrently active threads in the last polling interval.
Average Threads—Average number of threads in the thread pool in the last polling interval.
Memory
The normal operation of the WebSphere server relies on the performance of the Java virtual machine
(JVM) in which the server is running. APM monitors the JVM memory usage for the WebSphere server
and displays the monitoring details in the Memory area, as shown in Figure 258.