
HP Intelligent Management Center v5.2 Application Performance Manager Administrator Guide

361
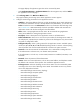
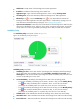
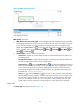
Figure 305 SMTP Receive area layout
SMTP Receive area fields:
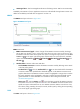
SMTP Receive connection trend graph—Shows changes of the inbound SMTP connections used by
Exchange Server 2007 over the last 1 hour in a line chart. Hover the cursor over a spot on the curve
to view the inbound SMTP connection number at the specific time point. To change the report
period, click the Last 1 Hour icon on the upper right of the graph, and then select an icon from
the list. Available options include Last 6 Hours , Today , Yesterday , This Week , This
Month , and This Year .
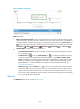
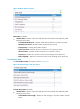
Attribute/Value—Monitor index name and data.
Connections—Number of inbound SMTP connections used by Exchange Server 2007 in the
last polling period.
Messages Received/Sec—Number of mail messages received per second by the SMTP service
used by Exchange Server 2007 in the last polling period.
Set Threshold icon —Click the Set Threshold icon to set alarm thresholds for the inbound
SMTP connection number or messages receive rate. The index value is highlighted in orange
when it reaches the level-1 threshold, and is highlighted in red when it reaches the level-2
threshold. Use the global thresholds or custom thresholds. For information about setting the
thresholds, see "Threshold Management."
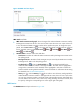
History icon —Click the History icon for an index to view the history trend graph of the
inbound SMTP connection number or message receive rate. Hover the cursor over a spot on the
curve to view connection number or receive rate value at the specific time point. Authorized
users can view statistics over the last 1 hour, last 6 hours, today, yesterday, this week, this
month, and this year by clicking the corresponding icons on the upper right of the graph.
Buffer State
The Buffer State area layout is shown in Figure 306.