
HP Intelligent Management Center v5.2 Application Performance Manager Administrator Guide

456
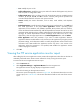
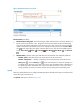
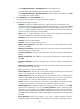
Figure 381 Connection Information area layout
Connection Information area fields:
Connection Time trend graph—Shows changes of the FTP connection time in the polling period
over the last 1 hour. Hover the cursor over a spot on the curve to view the connection time at the
specific time point. To change the report period, click the Last 1 Hour icon on the upper right of
the graph, and then select an icon from the list. Available options include Last 6 Hours , Today
, Yesterday , This Week , This Month , and This Year .
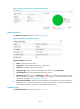
Attribute/Value—Monitor index name and data.
Connection Time—Shows how long it takes APM to last successfully connect to the FTP server.
Login Time—Shows how long it takes APM to last successfully log in the FTP server.
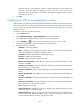
History icon —Click the History icon to view the history connection time or login time
changes in a line graph. Hover the cursor over a spot in the curve to view the connection time
or login time values at the specific time point. Authorized users can view the data over the last
1 hour, last 6 hours, today, yesterday, this week, this month, and this year by clicking the
corresponding icons.
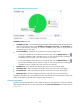
Set Threshold icon —Click the Set Threshold icon to set alarm thresholds for the
connection time or login time. The data is highlighted in orange when the connection time or
login time reaches the level-1 threshold, and is highlighted in red when the connection time or
login time reaches the level-2 threshold. You can either use the global thresholds or custom
thresholds. For information about setting thresholds, see "Threshold Management."
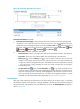
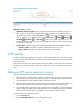
File Information
After login, APM collects files and directories in the home directory of the FTP account, not including
subdirectories and files in the directories. Contents displayed in the monitor report and the privileges to
upload, download, and delete files vary with different FTP accounts. The File Information area layout is
shown in Figure 382.