
HP Intelligent Management Center v5.2 Application Performance Manager Administrator Guide

474
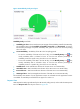
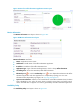
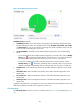
Figure 396 Availability Today area layout
Availability Today area fields:
Availability pie chart—Shows time duration percentages of the availability states for the URL today.
The availability states include Available, Unavailable, Inaccessible, and Unmanaged. To view the
time duration percentage of a specific availability state, place the cursor over the corresponding
slice in the chart.
Current Availability—Availability of the URL in the last polling period.
To view the availability of the URL in the last 7 days, click the Weekly History icon . The
weekly availability data is collected in hours. To view the time duration percentages of
availability states at a specific time, place the cursor over that time.
To view the availability of the URL in the last 30 days, click the Monthly History icon . The
monthly availability data is collected in days. To view the time duration percentages of
availability states on a specific day, place the cursor over that day.
Available Time—Total available time duration of the URL service since 00:00 today.
Unavailable Time—Total unavailable time duration of the URL service since 00:00 today.
Inaccessible Time—Total inaccessible time duration of the URL service since 00:00 today.
Unmanaged Time—Total unmanaged time duration of the URL service since 00:00 today.
The availability time statistics of a new application monitor are collected since the application monitor
was added. An availability time field does not appear if its value is 0.
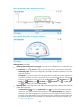
Response Time
APM requests the Web page indicated by the URL at each polling interval, and records the URL response
time. The Response Time area layout is shown in Figure 397.