
HP Intelligent Management Center v5.2 Application Performance Manager Administrator Guide

487
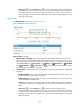
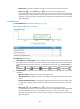
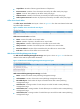
Requests/Sec—Number of requests received per second by Excel calculation services.
History icon —Click the History icon to view the history trend graph of the
corresponding index. Hover the cursor over a spot on the curve to view the monitor data at the
specific time point. Authorized users can view statistics over the last 1 hour, last 6 hours, today,
yesterday, this week, this month, and this year by clicking the corresponding icons on the upper
right of the graph.
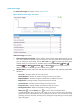
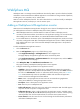
Excel Web Access
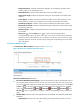
The Excel Web Access area layout is shown in Figure 408.
Figure 408 Excel Web Access area layout
Excel Web Access area fields:
Chart Requests/Sec trend graph—Shows changes of chart requests per second processed by the
Excel Web access over the last 1 hour. Hover the cursor over a spot on the curve to view the number
of chart requests at the specific time point. To change the report period, click the Last 1 Hour icon
on the upper right of the graph, and then select an icon from the list. Available options include
Last 6 Hours , Today , Yesterday , This Week , This Month , and This Year .
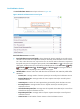
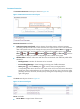
Attribute/Value—Monitor index name and data that was obtained when APM last polled Office
SharePoint.
Web Access Time—Average Excel Web access request time.
Chart Requests/Sec—Number of requests received per second processed by the Excel Web
access.
Average Chart Request Time—Average time length from the time when the Excel Web access
receives chart requests to the time when the Excel Web access sends responses to the Web
browser.
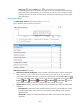
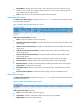
History icon —Click the History icon to view the history trend graph of the
corresponding. Hover the cursor over a spot on the curve to view the monitor data at the specific
time point. Authorized users can view statistics over the last 1 hour, last 6 hours, today,
yesterday, this week, this month, and this year by clicking the corresponding icons on the upper
right of the graph.