
HP Intelligent Management Center v5.2 Application Performance Manager Administrator Guide

131
Application Traffic
APM collects Mac OS traffic based on the IP address of the host where the application resides. The
Application Traffic area layout is shown in Figure 40.
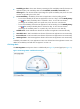
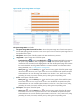
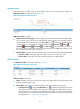
Figure 83 Application Traffic area layout
Application Traffic area fields:
Application Traffic trend graph—Shows changes of inbound and outbound Mac OS traffic over the
last 1 hour. The green curve shows the inbound traffic and the orange curve shows the outbound
traffic. To change the report period, click the Last 1 Hour icon on the upper right of the graph,
and then select an icon from the list. Available options include Last 6 Hours , Today ,
Yesterday , This Week , This Month , and This Year . Hover the cursor over a spot on
the curve to view the application traffic at the specific time point. Click Rx or Tx to display or hide
the corresponding monitor index in the graph.
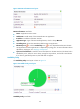
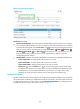
Attribute/Value—Monitor index name and data that was obtained when APM last polled Mac OS.
Last Hour's Traffic—Total traffic sent and received by Mac OS over the last 1 hour.
Today's Traffic—Total traffic sent and received by Mac OS since 00:00 today.
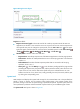
Network Interface
The Network Interface area layout is shown in Figure 84.
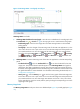
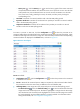
Figure 84 Network Interface area layout
Network Interface area fields:
Name—Identifier of a network interface card in Mac OS. APM monitors both physical and virtual
(logical) network interface cards.
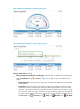
Receive Rate—Receive rate of a network interface card in the last APM polling period.
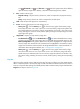
Set Threshold icon —Click the Set Threshold icon to set alarm thresholds for the receive
rate of Mac OS network interface cards. The data is highlighted in orange when the receive
rate reaches the level-1 threshold, and is highlighted in red when the receive rate reaches the
level-2 threshold. Use the global thresholds or custom thresholds. For information about setting
the thresholds, see "5 Configuration management."