
HP Intelligent Management Center v5.2 Application Performance Manager Administrator Guide

133
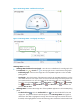
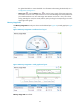
History icon —Click the History icon to view the history graph of the CPU usage ratio of
the monitored process. Hover the cursor over a spot on the curve to view the data at the specific
time point. Authorized users can view CPU usage statistics over the last 1 hour, last 6 hours,
today, yesterday, this week, this month, and this year by clicking the corresponding icons.
Memory Usage Ratio—Memory usage ratio of the monitored process in the last APM polling
period.
History icon —Click the History icon to view the history graph of the memory usage
ratio of the monitored process. Hover the cursor over a spot on the curve to view the data at the
specific time point. Authorized users can view memory usage statistics over the last 1 hour, last
6 hours, today, yesterday, this week, this month, and this year by clicking the corresponding
icons.
I/O State
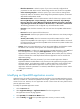
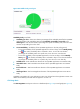
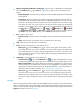
APM can monitor the I/O status of the disk drivers in the Mac OS, as shown in Figure 86.
Figure 86 I/O State area layout
I/O State area fields:
Device Name—Name of the disk drivers in the Mac OS.
I/O Rate—Size of the input/output data in the disk driver per second.
Transfer/Sec—Number of the transfer times in the disk driver per second. A transfer is an I/O
request to the physical disk. Multiple logical requests can be integrated into a single I/O request to
the disk. The size of the transferred data in each transfer is not fixed.
OpenBSD
OpenBSD's performance and stability greatly affects the performance of applications running on it. APM
provides the ability to monitor OpenBSD 4.6 or later versions of the operating system.
Adding an OpenBSD application monitor
APM monitors OpenBSD operating systems through CLI. When you add application monitors for
OpenBSD, follow these guidelines:
Enable Telnet or SSH on OpenBSD. For more information, see the OpenBSD configuration guide.
Obtain the correct username and password of the Telnet or SSH user who has the OpenBSD
administrator's privileges
To view traffic statistics in the monitor report of the OpenBSD application, make sure at least one
probe is configured in APM. After an OpenBSD application monitor is added, APM sends the IP
address of the monitored OpenBSD application to the probes for traffic collection.
To add an OpenBSD application monitor:
1. Click the Resource tab.
2. Enter the Add Application page in one of the following ways: