
HP Intelligent Management Center v5.2 Application Performance Manager Administrator Guide

198
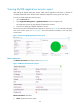
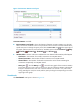
Health State—Health status of the MySQL application.
IP Address—IP address of the MySQL host.
Application Type—Type of the monitored application, which is always MySQL.
Version—MySQL version.
Port—Service port of MySQL.
Basic Directory—MySQL installation path recorded in MySQL.
Data Directory—MySQL data storage directory.
Last Polling Time—Time when APM last polled MySQL.
Relationship icon —Click the Relationship icon to view dependencies between MySQL
and other applications in the dependency topology. For more information about dependency
topologies, see "Topology management."
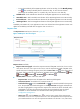
Top5 Unrecovered Alarm—Latest five unrecovered alarms on the MySQL host. The alarm level is
identified by color: yellow for minor alarms, orange for major alarms, and red for critical alarms.
This field does not appear if no alarm is generated by the MySQL application.
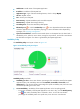
Availability Today
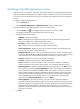
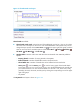
The Availability Today area layout is shown in Figure 147.
Figure 147 Availability Today area layout
Availability Today area fields:
Availability pie chart—Shows time duration percentages of the availability states for the MySQL
application today. The availability states include Available, Unavailable, Inaccessible, and
Unmanaged. To view the time duration percentage of a specific availability state, hover the cursor
over the corresponding slice in the chart.
Current Availability—Availability of the MySQL application in the last polling period.
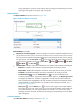
To view the availability of the MySQL application in the last 7 days, click the Weekly History
icon . The weekly availability data is collected in hours. To view the time duration
percentages of availability states at a specific time, hover the cursor over that time.