
HP Intelligent Management Center v5.2 Application Performance Manager Administrator Guide


212
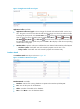
Top5 Unrecovered Alarm—Latest five unrecovered alarms on the Oracle host. The alarm level is
identified by color: yellow for minor alarms, orange for major alarms, and red for critical alarms.
This field does not appear if no alarm is generated by Oracle.
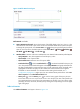
Availability Today
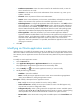
The Availability Today area layout is shown in Figure 160.
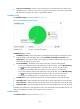
Figure 160 Availability Today area layout
Availability Today area fields:
Availability pie chart—Shows time duration percentages of the availability states for the Oracle
application today. The availability states include Available, Unavailable, Inaccessible, and
Unmanaged. To view the time duration percentage of a specific availability state, hover the cursor
over the corresponding slice in the chart.
Current Availability—Availability of the Oracle application in the last polling period.
To view the availability of the Oracle application in the last 7 days, click the Weekly History
icon . The weekly availability data is collected in hours. To view the time duration
percentages of availability states at a specific time, hover the cursor over that time.
To view the availability of the Oracle application in the last 30 days, click the Monthly History
icon . The monthly availability data is collected in days. To view the time duration
percentages of availability states on a specific day, hover the cursor over that day.
Available Time—Total available time duration of the Oracle application since 00:00 today.
Unavailable Time—Total unavailable time duration of the Oracle application since 00:00 today.
Inaccessible Time—Total inaccessible time duration of the Oracle application since 00:00 today.
Unmanaged Time—Total unmanaged time duration of the Oracle application since 00:00 today.
Availability time statistics of a new application monitor are collected since the application monitor was
added. An availability time field does not appear when its value is 0.
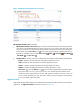
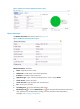
Database Details
The Database Details area layout is shown in Figure 161.