
HP Intelligent Management Center v5.2 Application Performance Manager Administrator Guide

214
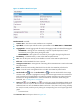
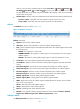
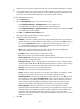
Figure 162 Connection Time area layout
Connection Time area fields:
Connection Time trend graph—Shows the changes of the connection time over the last 1 hour in a
line chart. Hover the cursor over a spot on the curve to view the connection time at the specific time
point. To change the report period, click the Last 1 Hour icon on the upper right of the graph,
and then select an icon from the list. Available options include Last 6 Hours , Today ,
Yesterday , This Week , This Month , and This Year .
Attribute/Value—Monitor index name and data that was obtained when APM last polled Oracle.
Connection Time—Time consumed when APM established the connection with Oracle.
Set Threshold icon —Click the Set Threshold icon to set alarm thresholds for the
connection time. The specified alarm thresholds appear on the Connection Time trend graph as
dotted lines. The data is highlighted in orange when the connection time reaches the level-1
threshold, and is highlighted in red when the connection time reaches the level-2 threshold. Use
the global thresholds or custom thresholds. For information about setting the thresholds, see "5
Configuration management."
History icon —Click the History icon to view the history graph of the connection time
trend. Hover the cursor over a spot on the curve to view the connection time at the specific time
point. Authorized users can view the connection time statistics over the last 1 hour, last 6 hours,
today, yesterday, this week, this month, and this year by clicking the corresponding icons on the
upper right of the graph.
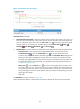
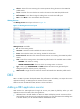
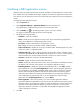
SGA State
The SGA State area layout is shown in Figure 163.
System Global Area (SGA) is a shared space that memory allocates for Oracle when Oracle starts.