
HP Intelligent Management Center v5.2 Application Performance Manager Administrator Guide

229
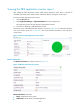
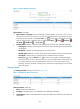
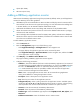
Figure 181 Cache Performance area layout
Cache Performance area fields:
Database Name—Name of the database.
Package Cache Hit Ratio—How often the required request sections have been found in the package
cache.
Catalog Cache Hit Ratio—How often the required table descriptors have been found in the catalog
cache.
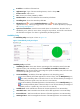
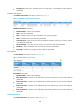
Application Traffic
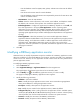
APM collects DB2 traffic based on the IP address of the host and the traffic collection port used by the
application. The Application Traffic area layout is shown in Figure 182.
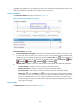
Figure 182 Application Traffic area layout
Application Traffic area fields:
Application Traffic trend graph—Shows changes of inbound and outbound traffic over the last 1
hour. The green curve shows the inbound traffic and the orange curve shows the outbound traffic.
To change the report period, click the Last 1 Hour icon on the upper right of the graph, and then
select an icon from the list. Available options include Last 6 Hours , Today , Yesterday ,
This Week , This Month , and This Year . Hover the cursor over a spot on the curve to view
the application traffic at the specific time point. Click Rx or Tx to display or hide the corresponding
monitor index in the graph.
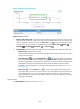
Attribute/Value—Monitor index name and data that was obtained when APM last polled DB2.
Last Hour's Traffic—Total traffic sent and received by DB2 over the last 1 hour.
Today's Traffic—Total traffic sent and received by DB2 since 00:00 today.
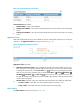
Buffer Statistics
The Buffer Statistics area layout is shown in Figure 183.