
HP Intelligent Management Center v5.2 Application Performance Manager Administrator Guide
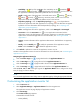

21
Host monitoring
Host monitoring focuses on the availability and the health status of applications on each host. You can
view a host monitor in either Host mode or in List mode.
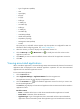
Viewing a host monitor in host mode
1. Click the Resource tab.
2. Select Application Manager > Host Monitor from the navigation tree.
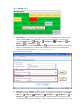
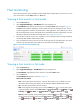
The Host Monitor page displays all host monitors in the default Host mode, as shown in Figure 11.
The Host mode organizes application monitors based on hosts. The background color of each
monitored application stands for the health status of that application. The availability icon to the
left of each application monitor name stands for the availability status of that application. For more
information about the availability and health status, see "Application monitor."
3. Click the device label of a host to view its details. For more information about viewing host details,
see HP IMC Base Platform Administrator Guide.
4. Click an application monitor name to view the monitoring report for that application. The report
contents vary with application types and will be described in subsequent chapters.
Figure 11 Host tab on the Host Monitor page
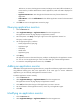
Viewing a host monitor in list mode
1. Click the Resource tab.
2. Select Application Manager > Host Monitor from the navigation tree.
The Host Monitor page displays all host monitors in the default Host mode.
3. Click the Host tab.
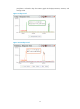
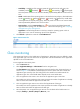
The Host Monitor List appears, as shown in Figure 12.
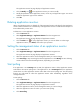
Host monitor list contents
Host—Device label of the host machine. Click the device label to view its details. For more
information about viewing host details, see HP IMC Base Platform Administrator Guide.
OS—Operation system used in the host machine.
CPU—CPU usage of the operating system. Click the History icon to view the history CPU
usage trend graph. Options include Last 1 Hour icon , Last 6 Hours icon , Today icon ,
Yesterday icon , This Week icon , This Month icon , and This Year icon .
Memory—Memory usage of the operating system. Click the History icon to view the history
memory usage trend graph. Options include Last 1 Hour icon , Last 6 Hours icon , Today
icon , Yesterday icon , This Week icon , This Month icon , and This Year icon .