
HP Intelligent Management Center v5.2 Application Performance Manager Administrator Guide

311
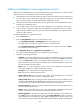
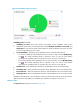
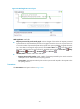
Figure 259 Web Application area layout
Web Application area fields:
Requests processed by servlet trend graph—Shows changes of the number of requests processed
by the Servlet over the selected time period in a line graph. Hover the cursor over a spot in the curve
to view the number of processed requests at the specific time point. By default, the graph shows the
last 1 hour data. To change the report period, click the Last 1 Hour icon on the upper right of
the graph, and then select an icon from the list. Available options include Last 6 Hours , Today
, Yesterday , This Week , This Month , and This Year .
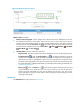
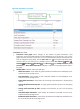
Attribute/Value—Monitor index name and data.
Requests Processed by Servlet—Total number of requests processed by the Servlet since the
WebSphere server started until the last polling interval.
Service Time—Average time taken by the Servlet to process and respond to the requests in the
last polling interval.
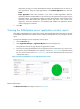
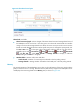
Transactions
The Transactions area layout is shown in Figure 260.