
HP Intelligent Management Center v5.2 Application Performance Manager Administrator Guide


364
Application Traffic
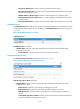
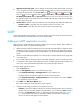
APM collects Exchange Server 2007 traffic based on the IP address of the host and the traffic collection
port used by the application. The Application Traffic area layout is shown in Figure 310.
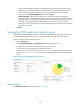
Figure 310 Application Traffic area layout
Application Traffic area fields:
Application Traffic trend graph—Shows changes of inbound and outbound traffic over the last 1
hour. The green curve shows the inbound traffic and the orange curve shows the outbound traffic.
To change the report period, click the Last 1 Hour icon on the upper right of the graph, and then
select an icon from the list. Available options include Last 6 Hours , Today , Yesterday ,
This Week , This Month , and This Year . Hover the cursor over a spot on the curve to view
the application traffic at the specific time point. Click Rx or Tx to display or hide the corresponding
monitor index in the graph.
Attribute/Value—Monitor index name and data that was obtained when APM last polled
Exchange Server 2007.
Last Hour's Traffic—Total traffic sent and received by Exchange Server 2007 over the last 1
hour.
Today's Traffic—Total traffic sent and received by Exchange Server 2007 since 00:00 today.
Availability State
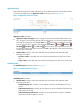
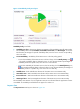
The Availability State area layout is shown in Figure 311.
Figure 311 Availability State area layout
Availability State area fields:
Attribute/Value—Monitor index name and data that was obtained when APM last polled
Exchange Server 2007.
Available Requests/Sec—Number of client requests received by the availability service per
second.
Public Folder Queries/Sec—Number of client requests to get the availability information from
public folders per second.
Public Folder Request Failures/Sec—Number of client request failures to get the availability
information from public folders per second.