
HP Intelligent Management Center v5.2 Application Performance Manager Administrator Guide

465
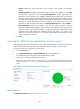
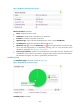
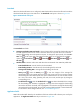
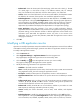
Availability pie chart—Shows time duration percentages of the availability states for the SFTP
service today. The availability states include Available, Unavailable, Inaccessible, and
Unmanaged. To view the time duration percentage of a specific availability state, place the cursor
over the corresponding slice in the chart.
Current Availability—Availability of the SFTP service in the last polling period.
To view the availability of the SFTP service in the last 7 days, click the Weekly History icon .
The weekly availability data is collected in hours. To view the time duration percentages of
availability states at a specific time, hover the cursor over that time.
To view the availability of the SFTP service in the last 30 days, click the Monthly History icon
. The monthly availability data is collected in days. To view the time duration percentages of
availability states on a specific day, hover the cursor over that day.
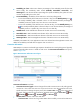
Available Time—Total available time duration of the SFTP service since 00:00 today.
Unavailable Time—Total unavailable time duration of the SFTP service since 00:00 today.
Inaccessible Time—Total inaccessible time duration of the SFTP service since 00:00 today.
Unmanaged Time—Total unmanaged time duration of the SFTP service since 00:00 today.
Availability time statistics of a new application monitor are collected since the application monitor was
added. An availability time field does not appear when its value is 0.
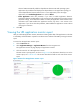
Connection Information
APM attempts to connect to and sends login requests to the SFTP server in each polling period. Typically,
a host that provides SFTP services is called an SFTP server. The Connection Information area layout is
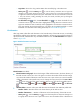
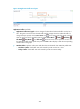
shown in Figure 389.
Figure 389 Connection Information area layout
Connection Information area fields:
Connection Time trend graph—Shows changes of the SFTP connection time in the polling period
over the last 1 hour. Hover the cursor over a spot on the curve to view the connection time at the
specific time point. To change the report period, click the Last 1 Hour icon on the upper right of
the graph, and then select an icon from the list. Available options include Last 6 Hours , Today
, Yesterday , This Week , This Month , and This Year .
Attribute/Value—Monitor index name and data.
Connection Time—Shows how long it takes APM to last successfully connect to the SFTP server.