
HP Intelligent Management Center v5.2 Application Performance Manager Administrator Guide


486
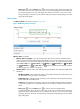
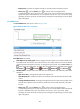
Delayed Documents—Number of documents delayed to be searched by the Office search
collector subject to site hit frequency rules.
Retried Documents—Number of documents that will be retried after timeout.
Active Queue Length—Number of documents waiting for robot threads in the Office search
collector.
Server Objects—Number of servers accessed by the Office search collector during a crawl.
Office SharePoint creates a server object for a server being accessed for the first time.
Created Server Objects—Number of server objects created by the Office search collector.
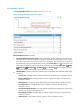
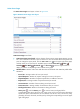
Network Access Threads—Number of threads waiting for responses from remote data storage
or processing responses.
Threads in Plugins—Number of threads that have been retrieved and are processed by plugins,
such as Ifilter.
History icon —Click the History icon to view the history trend graph of the
corresponding index. Hover the cursor over a spot on the curve to view the monitor data at the
specific time point. Authorized users can view statistics over the last 1 hour, last 6 hours, today,
yesterday, this week, this month, and this year by clicking the corresponding icons on the upper
right of the graph.
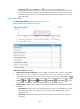
Excel Service Web Front End
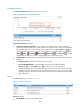
The Excel Service Web Front End area layout is shown in Figure 407.
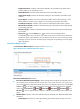
Figure 407 Excel Service Web Front End area layout
Excel Service Web Front End area fields:
Excel Service Web Front End trend graph—Shows changes of active requests and requests received
per second by Excel calculation services over the last 1 hour. Hover the cursor over a spot on the
curve to view the monitor data at the specific time point. To change the report period, click the Last
1 Hour icon on the upper right of the graph, and then select an icon from the list. Available
options include Last 6 Hours , Today , Yesterday , This Week , This Month , and
This Year . Click the legend names to display or hide the corresponding monitor indexes in the
graph.
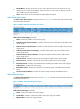
Attribute/Value—Monitor index name and data that was obtained when APM last polled Office
SharePoint.
Active Requests—Number of active requests being processed by Excel calculation services.