
HP Intelligent Management Center v5.2 Application Performance Manager Administrator Guide

505
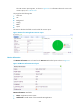
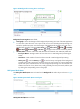
Unavailable Time—Total unavailable time duration of the SAP application since 00:00 today.
Inaccessible Time—Total inaccessible time duration of the SAP application since 00:00 today.
Unmanaged Time—Total unmanaged time duration of the SAP application since 00:00 today.
Availability time statistics of a new application monitor are collected since the application monitor was
added. An availability time field does not appear if its value is 0.
CPU Usage
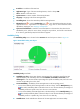
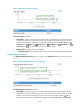
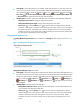
The CPU Usage area appears on both Overview and OS tabs. Its layout is shown in Figure 34.
Figure 427 CPU Usage area layout
CPU Usage area fields:
Trend graph—Shows the changes of the CPU usage for the SAP application in a line chart. Hover
the cursor over a spot on the curve to view the CPU usage ratio at the specific time point. Authorized
users can view the changes of the CPU usage over a specified time period by clicking the Last 1
Hour icon , Last 6 Hours icon , Today icon , Yesterday icon , This Week icon , This
Month icon , or This Year icon . The graph shows the last hour data by default.
Attribute/Value—Monitor index name and data.
CPU Usage—Transient CPU usage of the SAP application when it was last polled by APM.
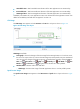
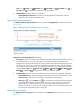
Spool Process Usage
The Spool Process Usage area appears on both Overview and Spool tabs. Its layout is shown in Figure
35.