
HP Intelligent Management Center v5.2 Application Performance Manager Administrator Guide

514
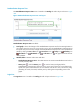
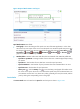
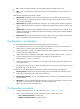
Figure 439 Login User area layout
Login User area fields:
Trend graph—Shows the changes in the number of users logged in SAP in a line chart. Hover the
cursor over a spot on the curve to view the number of login SAP users at the specific time point. View
the changes in the number of login SAP users over a specified time period by clicking the Last 1
hour icon , Last 6 hours icon , Today icon , Yesterday icon , This Week icon , This
Month icon , or This Year icon . The graph shows the last hour data by default.
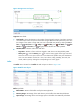
Attribute/Value—Monitor index name and data.
Login User—Number of users who have logged in SAP when it was last polled by APM.
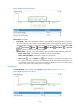
History icon —Click the History icon to view the history graph of the login user trend.
Hover the cursor over a spot on the curve to view data at the specific time point. Authorized
users can view statistics over the last 1 hour, last 6 hours, today, yesterday, this week, this
month, and this year by clicking the corresponding icons on the graph.
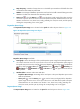
Buffer
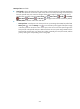
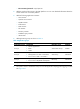
The Buffer area is located on the Buffer tab and its layout is shown in Figure 440.
Figure 440 Buffer area layout
Buffer area fields:
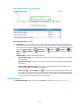
Buffer Name—Name of the buffer used by the SAP application.
Directory Usage—Percentage of the used directory in the buffer when APM last polled SAP.
Space Usage—Percentage of the used storage space in the buffer when APM last polled SAP.