
HP Intelligent Management Center v5.2 Application Performance Manager Administrator Guide

516
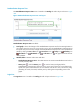
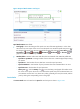
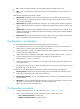
Figure 442 Request Queue Usage area layout
Request Queue Usage area fields:
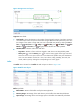
Trend graph—Shows the changes of the spool request queue usage for the SAP application in a
line chart. Hover the cursor over a spot on the curve to view the spool request queue usage at the
specific time point. View the changes of the spool request queue usage over a specified time period
by clicking the Last 1 hour icon , Last 6 hours icon , Today icon , Yesterday icon , This
Week icon , This Month icon , or This Year icon . The graph shows the last hour data by
default.
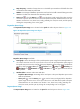
Attribute/Value—Monitor index name and data.
Request Queue Usage—Percentage of the used space in the spool request queue when APM
last polled SAP.
Request Queue Pages—Number of the pages stored in the spool request queue when APM last
polled SAP.
Request Queue Sequence Usage—Percentage of the space used for sorting requests in the
spool request queue when APM last polled SAP.
History icon —Click the History icon to view the history trend graph of the index. Hover
the cursor over a spot on the curve to view data at the specific time point. Authorized users can
view statistics over the last 1 hour, last 6 hours, today, yesterday, this week, this month, and this
year by clicking the corresponding icons on the graph.
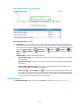
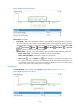
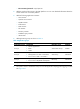
Spool Work Statistics
The Spool Work Statistics area is located on the Spool tab and its layout is shown in Figure 443.