
HP Intelligent Management Center v5.2 Application Performance Manager Administrator Guide

59
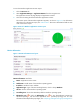
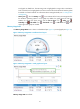
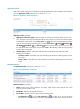
Figure 17 Ping Test area layout
Ping Test area fields:
Response time trend graph—Shows changes of the ping response time over the last 1 one hour in
a line graph. Hover the cursor over a spot on the curve to view the ping response time at the specific
time point. To change the report period, click the Last 1 Hour icon on the upper right of the
graph, and then select an icon from the list. Available options include Last 6 Hours , Today
, Yesterday , This Week , This Month , and This Year .
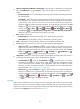
Attribute/Value—Monitor index name and data.
Response Time—Ping response time in the last ping test.
Packets Sent—Number of ICMP packets sent in the last ping test. The maximum value is 3.
Packets Received—Number of ICMP responses received by APM in the last ping test. The value
can be 0 or 1.
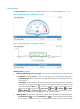
History icon —Click the History icon to view trend statistics of the history response time
in a line graph. By default, the graph shows the last hour statistics. To change the report period,
click the Last 6 Hours icon , Today icon , Yesterday icon , This Week icon , This
Month icon , or This Year icon on the upper right of the graph as needed.
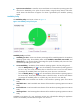
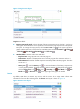
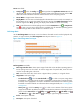
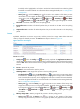
Service
By default, APM does not monitor any service, and the service list is empty. APM collects state
information of services after selecting them. The Service area layout is shown in Figure 18.
Figure 18 Service area layout