
HP Intelligent Management Center v5.2 Application Performance Manager Administrator Guide

60
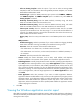
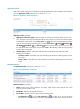
Service area fields:
Config icon —Click the Config icon . APM populates the Application Instance List with all
detected services running on the Windows operating system. Select desired services and click OK.
APM collects state information about the selected services in the next polling interval.
Service Name—Original name of the service.
Display Name—Service name or alias displayed on the Windows service console. For example, on
the Windows service console, the DHCP client service uses the alias DHCP Client Service rather
than the original name Dhcp. Typically, the display name identifies a service more clearly.
State—State of the service in the last polling interval. Click the Start Service icon or Stop Service
icon to start or stop a service. This function is available only for Windows operating systems
monitored through WMI on IMC installed on a Windows server
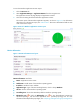
Disk Usage Ratio
Use the Disk Usage Ratio area layout to view how data is allocated on each root disk (physical disk,
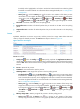
partition, or logical volume). The Disk Usage Ratio area layout is shown in Figure 19.
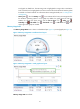
Figure 19 Disk Usage Ratio area layout
Disk Usage Ratio area fields:
Disk usage ratio bar chart—Shows space usage of each disk on the Windows operating system in
the last polling interval in a bar chart. To view the usage ratio of a specific disk, hover the cursor
over the corresponding bar in the chart.
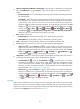
Disk—Drive letter of the disk, which can be a physical drive, a partition, or a logical volume.
Usage Ratio—Disk space usage.
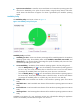
Set Threshold icon —Click the Set Threshold icon for a disk to set space usage alarm
thresholds for it. The usage ratio of the disk is highlighted in orange when it reaches the level-1
threshold, and is highlighted in red when it reaches the level-2 threshold. Use either the global
thresholds or custom thresholds. For information about setting thresholds, see "5 Configuration
management."
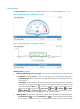
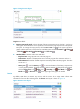
History icon —Click the History icon for a disk to view statistics of the history space
usage trend of the disk. By default, the graph shows the last hour statistics. To change the report
period, click the Last 6 Hours icon , Today icon , Yesterday icon , This Week icon
, This Month icon , or This Year icon on the upper right of the graph as needed.
In Use—Used space of the disk.
Free Space—Free space of the disk.