
HP Intelligent Management Center v5.2 Application Performance Manager Administrator Guide

86
Set Threshold icon —Click the Threshold setting icon to set alarm thresholds of the CPU
usage ratio for the monitored process. The data is highlighted in orange when the CPU usage
ratio reaches the level-1 threshold, and is highlighted in red when the CPU usage ratio reaches
the level-2 threshold. Use the global thresholds or custom thresholds. For information about
setting the thresholds, see "5 Configuration management."
History icon —Click the History icon to view the history graph of the CPU usage ratio of
the monitored process. Hover the cursor over a spot on the curve to view the data at the specific
time point. Authorized users can view CPU usage statistics over the last 1 hour, last 6 hours,
today, yesterday, this week, this month, and this year by clicking the corresponding icons.
Memory Usage Ratio—Memory usage ratio of the monitored process in the last APM polling
period.
History icon —Click the History icon to view the history graph of the memory usage
ratio of the monitored process. Hover the cursor over a spot on the curve to view the data at the
specific time point. Authorized users can view memory usage statistics over the last 1 hour, last
6 hours, today, yesterday, this week, this month, and this year by clicking the corresponding
icons.
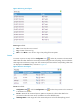
I/O State
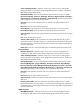
APM can monitor the I/O status of the disk drivers in the AIX system, as shown in Figure 44.
Figure 44 I/O State area layout
I/O State area fields:
Device Name—Name of the disk drivers in the AIX system.
I/O Rate—Size of the input/output data in the disk driver per second.
IOs/Sec—Number of the transfer times in the disk driver per second. A transfer is an I/O request
to the physical disk. Multiple logical requests can be integrated into a single I/O request to the disk.
The size of the transferred data in each transfer is not fixed.
Solaris
Solaris can be installed on the servers with x86 or SPARC processors. The performance and stability of
Solaris greatly affects the performance of applications or services running on it. APM provides the ability
to monitor Solaris 5.10 or later versions of the operating system.
Adding a Solaris application monitor
APM can monitor Solaris through CLI or SNMP. When you add application monitors for Solaris, follow
these guidelines: