
HP Intelligent Management Center v5.1 SP1 Application Manager Administrator Guide

204
higher the hit ratio index is, the performance is better, so the threshold condition ought to be
set to “Less than or equal to.”
History Record—Click the History Record icon to view the connection time related index
trend in a past time period, which includes the last 1 hour, last 6 hours, today, yesterday, this
week, this month, and this year. If you select the time period Last 1 hour, Last 6 hours, or
Today, the connection time related index of the Oracle is measured in unit of a polling
interval; if you select the time period Yesterday, This week, or This month, the
connection time of the Oracle is measured in hours, and the diagram displays the connection
time related index trend, and the maximum, minimize, and average connection time of the
Oracle; if you select the time period This year, the connection time of the Oracle is
measured in days, and the diagram displays the connection time trend, and the maximum,
minimize, and average connection time of the Oracle. Move the pointer over the each
sampling point to view the connection time of the Oracle for the time being.
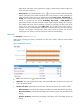
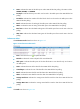
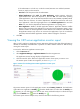
SGA status
The SGA Status is shown in Figure 152.
When Oracle is starting, the memory will dispute one share space which is called as System Global
Area (SGA).
Figure 152 SGA status-Oracle
• Fresh—click the Fresh icon to update the detail.
• SGA Status—This chart displays the hit ration of the SGA buffer areas. Put the mouse on the chart
to view the specific details.
• Attribute and Value—Indicate the name and date of the monitor indexes. The indexes include:
Buffer Hit Ration—Indicate the percentage in the buffer area when APM did the last polling.
Dictionary Hit Ration—Indicate the percentage in the dictionary cache when APM did the last
polling.
Database Hit Ration—Indicate the percentage in the library cache when APM did the last
polling.