
HP Intelligent Management Center v5.1 SP1 Application Manager Administrator Guide

59
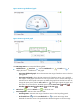
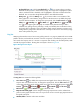
Response Time—Ping response time in the last ping test.
Packets Sent—Number of ICMP packets sent in the last ping test. The maximum value is 3.
Packets Received—Number of ICMP responses received by APM in the last ping test. The
value can be 0 or 1.
History icon —Click the History icon to view trend statistics of the history response
time in a line graph. By default, the graph shows the last hour statistics. To change the report
period, click the Last 6 Hours icon , Today icon , Yesterday icon , This Week icon
, This Month icon , or This Year icon on the upper right of the graph as needed.
Hourly data and today's data is collected every polling interval, yesterday's, weekly, and
monthly data is collected in hours, and yearly data is collected in days. The statistics graph
contains maximum, minimum, and average response time values. Place the cursor over a spot
in the curve to view response time values at the specific time point.
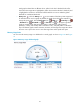
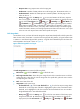
Disk Usage Ratio
On Windows Server, each root disk must be assigned a unique letter identify itself in the file system. The
letter is known as the "drive letter." A root disk can be a physical disk, partition, or logical volume. Data
is written to or read from the physical disk, partition, or logical volume identified by the drive letter. The
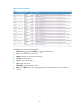
Disk Usage Ratio area layout is shown in Figure 29.
Figure 29 Disk Usage Ratio area layout
The Disk Usage Ratio area contains the following fields:
• Refresh icon —Click the Refresh icon to refresh the area.
• Disk usage ratio bar chart—Shows the space usage of each disk on Windows Server in the last
polling interval in a bar chart. To view the usage ratio of a specific disk, place the cursor over the
corresponding bar in the chart.
• Disk—Drive letter of the disk.
• Usage Ratio—Disk space usage.
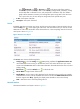
Set Threshold icon —Click the Set Threshold icon for a disk to set space usage alarm
thresholds for it. The usage ratio of the disk is highlighted in yellow when it reaches the level-1
threshold, and is highlighted in red when it reaches the level-2 threshold. You can use either
the global thresholds or user-defined thresholds.
History icon —Click the History icon for a disk to view statistics of the history space
usage trend of the disk. By default, the graph shows the last hour statistics. To change the
report period, click the Last 6 Hours icon , Today icon , Yesterday icon , This Week