HP Intelligent Management Center Application Manager Administrator Guide Part number: 5998-3312 Software version: IMC APM 5.
Legal and notice information © Copyright 2012 Hewlett-Packard Development Company, L.P. No part of this documentation may be reproduced or transmitted in any form or by any means without prior written consent of Hewlett-Packard Development Company, L.P. The information contained herein is subject to change without notice.
Contents 1 Application Manager overview ······························································································································· 1 Installation and network planning ··································································································································· 1 Installation requirements ·········································································································································· 1 APM net
Adding an application group ······························································································································ 35 Modifying an application group ························································································································· 35 Deleting an application group ····························································································································· 36 5 Configuration management ···········
Viewing the Mac OS application monitor report ···························································································· 122 OpenBSD ······································································································································································ 133 Adding an OpenBSD application monitor ······································································································· 133 Modifying an OpenBSD application monitor ···
Viewing the Tomcat server application monitor report ··················································································· 270 Oracle Application Server ·········································································································································· 275 Configuring the Oracle Application Server ······································································································ 276 Adding an Oracle AS application monitor ·············
Viewing the RESTful Web service application monitor report ········································································ 381 SOAP-based Web service··········································································································································· 385 Adding a SOAP-based Web service application monitor ·············································································· 385 Modifying a SOAP-based Web service application monitor ····················
Adding an Office SharePoint application monitor ·························································································· 477 Modifying an Office SharePoint application monitor ····················································································· 478 Viewing the Office SharePoint application monitor report ············································································· 479 WebSphere MQ ············································································
1 Application Manager overview Application Manager (APM) is a network management software product based on the IMC platform. It is used to monitor various applications in the network. During the monitoring process, APM collects data from the applications and generates an application monitor report that can be used by operators to resolve application performance bottleneck problems, and ensure that network services are available, reliable, and continuous.
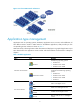
Figure 2 An classic APM network architecture Application type management Applications such as operating systems, databases, application servers, services, and middleware, all have different monitor modes in APM. Based on the different applications, APM provides you with corresponding monitor solutions as shown in Table 1. APM continuously collects application index information and displays it in a graphical application report.
Class Type Remarks OpenBSD 4.6 and higher version OpenBSD HP-UX 11.00 and higher version HP-UX Linux Server Monitor Linux SUSE CentOS and so on MySQL 5.x MySQL Oracle 8.x/9i/10g/11g Oracle DB2/NT 8.2.0 and higher version DB2 Database Server Monitor DBQuery is supported on the following databases: DBQuery SQL Server MySQL Oracle DB2 Sybase Sybase Adaptive Server Enterprise 12.5.2 and higher version Sybase All versions .NET Server JBoss 4.x/5.0.
Class Type Remarks IIS 6.0 and higher version IIS Server N/A PHP Exchange 2003 Mail Server Monitor Exchange 2007 N/A SMTP Office SharePoint WebSphere MQ Web Service Monitor LDAP Service Monitor Active Directory N/A Active directory deployed on Windows Server 2003/2008 N/A N/A File N/A Directory N/A SNMP N/A DNS Service Monitor WebSphere MQ 6.
Class SAP Monitor Type Remarks SAP R/3 4.6c-Redhat SAP APM communication management APM monitors applications using different protocols and technologies. It predefines one or multiple of the following methods for each type of application monitors: SNMP—Simple Network Management Protocol (SNMP) is supported broadly by operating systems and network devices. APM collects host monitor index information through the SNMP Agent which is deployed in the host. The default SNMP Agent listening port is UDP 161.
Figure 3 Application monitor and views As shown in Figure 3, APM supports the following views: Application monitor—Provides several different templates which are composed of a set of corresponding parameters and configurations. Using these specific templates, APM collects and analyzes monitor data based on host monitor, class monitor, and custom view. Host monitor—Analyzes and assesses the availability and health status of the host on which the applications run.
Port Configuration—Allows you to manage the ports through which applications listen to data and provide services. An application might use multiple ports. Probe Configuration—Allows you to configure probes for APM to collect application data and displays the data in monitor reports. Parameter Configuration—Allows you to set APM system parameters, such as data retention periods. For more information, see "5 Configuration management.
2 Quick start This section describes how to monitor applications and view the monitoring report. It is designed for administrators using the APM service component for the first time, or for those planning to add application monitors in batches. Prerequisites Before you monitor an application in APM, complete the following tasks: 1. Obtain general information related to the target application.
a. Click the selection arrow to the left of the device folder to open the device list. The following device lists appear: IP View Device View Custom View b. Click Device View, IP View, Custom View, or a subview. All devices in that view or subview appear in the Devices Found area. By advanced query c. Click the Advanced tab. d. Complete one or multiple of the following fields: Device IP—Input the IPv4 address for the devices you want to query.
8. In the detection result list, click Add to Monitor of the application you want to monitor, and then set the parameters of the application monitor. Application monitor configuration varies with application types. Detailed configuration procedures will be described in subsequent chapters. Different entries in the detection result list might have the same application type or port number.
Figure 4 DNS application monitor report Icon description Health Status—Indicates the evaluation result of the application. This field can display (Healthy), (Minor), (Major), (Critical), or (Unknown). When the application is unhealthy, you can click the icon to analyze the root cause of the application.
Figure 5 Root cause analysis Analyze the information of nodes in yellow, orange and red to identify the potential root causes. APM does not provide the root cause analysis for applications whose availability status is Unavailable, Unreachable, or Unmanaged. For more information about availability and health status, see "3 Monitor management." Refresh icon—Click the Refresh icon to refresh the entire monitoring report page or the data in a specific area.
Figure 7 Monthly History Time Range icon—Indicates the time range based on which the data graph was generated. By default, the Last 1 Hour icon is displayed. Click the icon to select another icon from the list, including Last 6 Hours icon , Today icon , Yesterday icon , This Week icon , This Month icon , and This Year icon . Set Threshold icon—Click the Set Threshold icon to set the alarm thresholds for the application. When a specified threshold is reached, APM will generate an alarm.
yearly data is collected in days. The statistics graph also displays maximum, minimum, and average values.
3 Monitor management Monitor management in APM allows you to collect performance indexes, health statuses, and availability of applications, and provides analysis and statistics reports based on this information in various views. Important concepts and terms in monitor management include: Monitor—Employs a background program to collect application index data by using a set of access parameters and to analyze the health status and availability for the application.
Critical—The application is available and the monitored indexes collected by APM meet the condition of a Level-2 threshold, or the application is unavailable. This health status can trigger a critical alarm. Unknown—The application is inaccessible or unmanaged. This health status is represented by two consecutive hyphens (--) in APM.
3. Availability—Availability of the application. The availability can be (Available), (Unavailable), (Inaccessible), or (Unmanaged). Move the pointer over the icon to view the application availability represented by different colors for the last hour. Health—Health status of the application. The health status can be (Healthy), (Minor), (Major), (Critical), or (Unknown). Move the pointer over the icon to view the application health status represented by different colors in the last hour.
Type of application (Default) Host Speed (bps) Rx (bps) Tx (bps) Traffic (H) In Traffic (H) Out Traffic (H) Traffic (D) In Traffic (D) Out Traffic (D) Availability (Default) Health status (Default) Dependency Topology Management status (Default) Contact The speed, Rx, Tx, and traffic columns appear only when probes are configured for APM. For information about configuring probes, see "Probe Configuration." 4.
.NET Server, IIS Server, Exchange Server 2003, Exchange Server 2007, Office SharePoint, or Active Directory. To detect Performance Counter applications, make sure APM is deployed on Windows. 4. Application Monitor Port—Port through which the Auto Discovery function detects the application. Add to Monitor—Click the Add to Monitor link to add an application monitor for the associated application. Click Back to return to the application monitor list page. Querying application monitors 1.
The application monitor list page displays all application monitors. 3. Click the Modify icon for the application monitor you want to modify. 4. Modify the parameters of the application monitor, which vary with application types. You cannot modify the application type or the IP address. 5. Click OK. Deleting application monitors When an application monitor is deleted, all of the associated monitor index data for that application monitor instance is deleted.
Host monitoring Host monitoring focuses on the availability and the health status of applications on each host. You can view a host monitor in either Host mode or in List mode. Viewing a host monitor in host mode 1. Click the Resource tab. 2. Select Application Manager > Host Monitor from the navigation tree. The Host Monitor page displays all host monitors in the default Host mode, as shown in Figure 11. The Host mode organizes application monitors based on hosts.
Availability—Availability of the operating system of the host for the last poll query. The availability can be (Available), (Unavailable), (Inaccessible), or (Unmanaged). Move the pointer over the icon to view the availability represented by different colors for the last hour. Heath—Health status of the operating system on the host for the last poll query. The health status can be (Healthy), (Minor), (Major), (Critical), or (Unknown). Health status of the application for the last polling query.
Figure 13 Class monitor Custom views APM allows operators to combine concerned indexes of different applications into one custom page to supply the support for the whole service performance and health status. Viewing the custom view list 1. Click the Resource tab. 2. Select Application Manager > Custom View from the navigation tree. The Custom View List page displays all custom views. Custom view list contents 3. Name—Name of the custom view. Description—Details of the custom view.
Viewing custom view details 1. Click the Resource tab. 2. Select Application Manager > Custom View from the navigation tree. The Custom View List page displays all custom views. 3. Click the name of a custom view to view its details. Custom view details 3. Name—Name of the custom view. Description—Description of the custom view. Application index list—Entire application monitor indexes for the custom view. Application List Index—Application index name used by the custom view.
The Add Custom View page appears. 4. Modify the description of the custom view. Description is helpful for managing and maintaining the custom view. You cannot modify the name of the custom view. 5. Click Add in the application index list. The Select Application Index dialog box appears. a. Click the Unfold icon or Fold icon to expand or collapse an application type/application monitor index. One application type could contain one or more applications under the selected type. b.
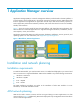
4 Topology and application group management APM offers flexible topology and application group management functions. Through a topology, operators can view dependencies among applications and quickly locate network problems. Application group management enables operators to manage applications according to different authority levels. The monitoring reports of applications in an application group can be viewed only by operators who have the management privileges to that group.
Tool Description Hides or displays interface numbers of the nodes on the topology. Saves the topology after adjustment. Displays the topology in a bird's-eye view, from which operators can quickly understand the general layout of the topology and locate the current screen of topology in the whole topology map. Operators can click the Hide/Show icon / located to the lower right corner to hide or display the bird's-eye view as needed.
Figure 14 Application topology window Table 4 Application topology icons Icon Description Represents a host for which APM does not monitor the operating system. Represents a host for which APM is monitoring the operating system. The logo attached to the host icon varies with operating systems. Represents an application monitored by APM. The icon varies with the application type. For more information about the application type management, see "1 Application Manager overview.
Icon Description Represents the physical network to which an access device is connected. Represents dependencies between two applications that use the same IP address. A dashed line represents indirect dependencies between the applications. Indirect dependencies are generated when the current operator has no management privileges to one or more intermediate applications. Represents dependencies between two applications that use different IP addresses.
Figure 15 Dependency topology window Viewing a host topology A host topology focuses on a single host and displays dependencies of the operating system that runs on it with other applications. To view a host topology: 1. Click the Resource tab. 2. Select Application Manager > Host Monitor from the navigation tree. The Host Monitor page displays all host monitors in the default Host mode. 3. Click the Host tab. The Host Monitor List appears. 4.
Figure 16 Host topology window Viewing a group topology A group topology focuses on a single application group and displays all its subgroups and applications in each subgroup. To view the group topology for an application group: 1. Click the Resource tab. 2. Select Application Manager > Application Group from the navigation tree. The application group list page displays all application groups. 3. Click the Group Topology icon topology.
Figure 17 Group topology window Table 5 Group topology icons Icon Description Represents an application monitored by APM. The icon varies with the application type. For more information about the application type management, see "1 Application Manager overview." Represents an application group. Represents the number and highest severity of unrecovered alarms for an application. This icon does not appear if no unrecovered alarm exists for the application.
Icon Description Represents the health status of an application for the last polling query. The health status of an application group is determined by the application with the worst health status in the group or its subgroup. For more information about the icon to display, see "3 Monitor management." Points to a subgroup or application that an application group contains.
Figure 18 Root cause analysis Details—Click the Details icon to view detailed information about the application group. Modify—Click the Modify icon to modify the application group. Delete—Click the Delete icon to delete the application group. Navigating the application list Click the Previous Page icon to page backward in the Application list. Click the Next Page icon Click the First Page icon to page forward to the end of the Application list.
4. Operator Group—Names of the operator groups to manage the application group and applications in the application group. For information about viewing operators in the group, see HP IMC Base Platform Administrator Guide. Application—All applications that belong to the application group. Parent Group—Application group's parent group. Every application group can belong to at most one parent group only. Click Back to go back to the application list page. Adding an application group 1.
The Select Operator Group page appears. b. Select one or more operator groups as needed. c. Click OK. All selected operator groups appear in the Operator Group box. d. Select one or multiple operator groups that you no longer permit to manage the application group and its members in the Operator Group box. e. Click Delete. The selected operator group is removed from the Operator Group box. 7. Modify applications in the group. a. Click Add. The Select Application page appears. b.
5 Configuration management APM provides the following additional configuration management functions: Threshold Management—Sets threshold conditions for the monitoring application indexes. If the collected indexes meet the threshold, APM sends a corresponding alarm through the Alarm module of the IMC Platform. Port Configuration—Sets default application monitor and traffic collection ports for applications.
Index—Name of the application index. Threshold Condition—Threshold condition, which can be Greater than or equal to (≥), Less than or equal to (≤), Include, or Exclude. Enable Level-1 Threshold—Displays whether the Level-1 threshold for the monitor index has been set. Level-1 Threshold—Level-1 threshold value of the monitor index. Enable Level-2 Threshold—Displays whether the Level-2 threshold for the monitor index has been set.
6. Index/Threshold Type—Click Select and select an application monitor index from the popup window. The name of the selected monitor index automatically populates the Index field, and the type of the selected monitor index automatically populates the Threshold Type field. The monitor index type can be Value or String. Threshold Condition—Select a threshold condition from the list. The available options vary with the monitor index type.
Deleting a global threshold You can delete only the user-defined global thresholds. After a global threshold is deleted, it is no longer valid for the corresponding monitor index on the Threshold Setting page navigated from an application monitor report page or a custom application monitor report page. To delete a user-defined global threshold: 1. Click the Resource tab. 2. Select Application Manager > Configurations from the navigation tree. The Configurations page appears. 3.
4. Enable Level-2 Threshold/Threshold—Configure the level-2 threshold setting for the monitor index. If you enable the level-2 threshold, set a level-2 threshold value in the Threshold field. APM activates a critical alarm when the monitor index meets the threshold. Click OK. Port Configuration An application can listen to data and provide services through multiple ports. With these ports, APM finds applications running on the host and reads monitor indexes to calculate traffic statistics.
Application type Application monitor port Traffic collection port Oracle Application Server TCP 8888 TCP 8888 WebLogic Server TCP 7001 TCP 7001 Glassfish Server TCP 8686 TCP 8686 WebSphere Server TCP 8080 TCP 8080 TCP 80 TCP 80 TCP 135 TCP 135 POP3 TCP 110 TCP 110 SMTP TCP 25 TCP 25 Office SharePoint TCP 135 N/A WebSphere MQ TCP 1414 TCP 1414 N/A N/A URL TCP 80 N/A Active Directory TCP 135 TCP 135 LDAP Service TCP 389 N/A N/A N/A SNMP Service UDP 161 UDP 161 FT
Modify—Click the Modify icon to modify default port settings for the application type. 4. Click Refresh to refresh the application default port list. 5. Click Back to return to the Configurations page. Modifying the application default port list To modify the default ports of an application type: 1. Click the Resource tab. 2. Select Application Manager > Configurations from the navigation tree. The Configurations page appears. 3. Click Port Configuration.
4. Modify—Click the Modify icon Delete—Click the Delete icon to modify the probe settings. to delete the probe. Click Refresh to refresh the probe list. Viewing the probe details 1. Click the Resource tab. 2. Select Application Manager > Configurations from the navigation tree. The Configurations page appears. 3. Click Probe Configuration. The Probe List appears. 4. Click the name of the probe whose details you want to view. Probe details 5. Name—Name of the probe.
5. Configure the following parameters: Name—Modify the name of the probe. The name must be unique in APM. IP Address—Modify the IP address of the probe. Description—Modify the description of the probe to aid maintenance. 6. Password—Modify the password for APM to access the probe. The password must be the same as that configured on the probe. Click OK. Deleting a probe 1. Click the Resource tab. 2. Select Application Manager > Configurations from the navigation tree.
4. Configure the following parameters as needed: Original Data Retention Time (Day)—Enter how many days APM will keep the original data collected from applications. Hourly Data Retention Time (Month)—Enter how many months APM will keep the hourly application data that is aggregated from the original data. Daily Data Retention Time (Year)—Enter how many years APM will keep the daily application data that is aggregated from the original data.
6 Widget management The APM Widget Management module lets you display the application topology, application monitor lists, and host monitor list on the IMC home page as widgets. For more information about adding widgets to the IMC home page, see HP IMC Base Platform Administrator Guide. Application Topology widget Figure 7 shows the Application Topology widget.
4. Select an interval from the list. The available options are No Refresh, 1, 5, 10 and 30, in minutes. If you select No Refresh, click the Refresh icon latest topology. 5. in the right top corner of the widget to view the Click OK. Application Monitor widget Figure 8 shows an Application Monitor widget. In the widget, you can monitor the availability and health state of applications directly, and open the application monitor report by clicking the application name.
Setting the refresh interval To set the refresh interval for an application monitor widget: 1. Log in to IMC and add an Application Monitor widget to the home page. 2. Click the Set icon 3. Click Interval Settings to open the Setting page. 4. Select an interval from the list. The available options are No Refresh, 1, 5, 10, and 30, in minutes. in the right top corner of the Application Monitor widget. If you select No Refresh, click the Refresh icon latest data. 5.
7 Windows OS monitor APM monitors the following Windows OS applications: Windows Windows XP Windows Server 2003 Windows Server 2008 Windows performance counters This chapter describes how to add and modify Windows OS application monitors, and helps you view relevant monitor reports. Windows Windows operating systems provide a base platform for a variety of desktop-oriented applications. To ensure service quality, its performance and stability must be guaranteed.
2. Enter the Add Application page in one of the following ways: Select Application Management > Add Application from the navigation tree. The page displays all application types that can be monitored by APM. 3. Select Application Management > Application Monitor from the navigation tree, and click Add on the application monitor list page. Click Windows of the Windows Server Monitor class. The page for adding a Windows application monitor appears. 4.
If the administrator is a domain user, use domain name\username. If the administrator is a local user, use host name\username or IP address\username, or use username. 5. Password—Enter the password of the administrator. Contact—Enter contact information, such as name, email address, and telephone number. The default is the username of the operator who created the application monitor. Related Applications—Configure the applications that the Windows operating system depends on.
Select an Existing Template—Select this option if you want to select an existing SNMP template for APM. For information about setting SNMP parameter templates, see HP IMC Base Platform Administrator Guide. Parameter Type—Select the SNMP parameter type. Options include SNMPv1, SNMPv2c, and SNMPv3 Template. The SNMPv3 Template option is available only when Select an Existing Template is selected.
To view the Windows application monitor report: 1. Click the Resource tab. 2. Select Application Manager > Application Monitor from the navigation tree. The application monitor list page displays all application monitors. 3. Click the link naming the desired Windows application monitor. The monitor report of the Windows application appears, as shown in Figure 10. For information about the icons in the monitor report, see "2 Quick start.
Top5 Unrecovered Alarms—Latest five unrecovered alarms on the Windows operating system. The alarm level is identified by color: yellow for minor alarms, orange for major alarms, and red for critical alarms. This field does not appear if no alarm is generated by the Windows operating system. Availability Today The Availability Today area layout is shown in Figure 12.
CPU Usage Ratio The CPU Usage Ratio area is shown in a dashboard (see Figure 13) or trend graph (see Figure 14). Figure 13 CPU Usage Ratio—Dashboard area layout Figure 14 CPU Usage Ratio—Trend graph area layout CPU Usage Ratio area fields: CPU Usage Ratio dashboard or trend graph—View the area in a dashboard or a trend graph. Click the Dashboard icon or Trend icon on the top right corner to switch between the graphs.
trend graph as dotted lines. The CPU usage ratio is highlighted in orange when it reaches the level-1 threshold, and is highlighted in red when it reaches the level-2 threshold. Use the global thresholds or custom thresholds. For information about setting thresholds, see "5 Configuration management." History icon —Click the History icon to view statistics of the history CPU usage trend for the Windows operating system in a line graph. By default, the graph shows the last hour statistics.
Memory Usage Ratio dashboard or trend graph—View the area in a dashboard or a trend graph. Click the Dashboard icon graphs. or Trend icon on the top right corner to switch between the Dashboard graph—Shows the transient memory usage of the Windows operating system in the last polling period. Trend graph—Shows the memory usage trend of the Windows operating system over the last 1 hour. The green curve represents the physical memory and the orange curve represents the virtual memory.
Figure 17 Ping Test area layout Ping Test area fields: Response time trend graph—Shows changes of the ping response time over the last 1 one hour in a line graph. Hover the cursor over a spot on the curve to view the ping response time at the specific time point. To change the report period, click the Last 1 Hour icon on the upper right of the graph, and then select an icon from the list. Available options include Last 6 Hours , Today , Yesterday , This Week , This Month , and This Year .
Service area fields: Config icon —Click the Config icon . APM populates the Application Instance List with all detected services running on the Windows operating system. Select desired services and click OK. APM collects state information about the selected services in the next polling interval. Service Name—Original name of the service. Display Name—Service name or alias displayed on the Windows service console.
Application Traffic APM collects traffic statistics for the Windows operating system based on the IP address of the Windows host. The Application Traffic area layout is as shown in Figure 20. Figure 20 Application Traffic area layout Application Traffic area fields: Application Traffic trend graph—Shows changes of inbound and outbound traffic over the last 1 hour. The green curve shows the inbound traffic and the orange curve shows the outbound traffic.
threshold, and is highlighted in red when it reaches the level-2 threshold. Use either the global thresholds or custom thresholds. For information about setting thresholds, see "5 Configuration management." History icon —Click the History icon for a NIC to view statistics of the history receive rate trend for it in a line graph. By default, the graph shows the last hour statistics.
statistics. To change the report period, click the Last 6 Hours icon , Today icon , Yesterday icon , This Week icon , This Month icon , or This Year icon on the upper right of the graph as needed. Event To monitor Windows events in APM, ensure the Monitor Type is set to WMI and the Enable Event Logging option is selected for the Windows application monitor. The Event area displays up to 10 most recent events, as shown in Figure 23.
Windows Server 2008 Windows 7 Adding a Windows performance counter application monitor APM monitors Windows performance counters through WMI. When you add application monitors for Windows performance counters, follow these guidelines: Enable and configure WMI for the target Windows operating system (see the Microsoft Windows operating system online help).
5. Related Applications—Configure the applications that the Windows performance counter application depend on. Click Add, and then select applications in the popup Select Applications window. Operating system applications, such as Windows, AIX, FreeBSD, OpenBSD, HP-UX, Solaris, Mac OS, and Linux, cannot be selected.
5. Password—Modify the password of the administrator. Contact—Modify the contact information, such as name, email address, and telephone number. The default is the username of the operator who created the application monitor. Related Applications—Modify the applications that the Windows performance counter application depends on. Click Add, and then select applications in the popup Select Applications window.
Figure 24 Part of a Windows performance counter application monitor report Monitor Information Figure 25 Monitor Information area layout Monitor Information area fields: Name—Application monitor name. Health State—Health status of the Windows performance counter. IP Address—IP address of the host running the Windows operating system. Application Type—Type of the monitored application, which is always Performance Counter.
Figure 26 Availability Today area layout Availability Today area fields: Availability pie chart—Shows time duration percentages of the availability states for the Windows performance counter today. The availability states include Available, Unavailable, Inaccessible, and Unmanaged. To view the time duration percentage of a specific availability state, hover the cursor over the corresponding slice in the chart.
Figure 27 Ping Test area layout Ping Test area fields: Response time trend graph—Shows changes of the ping response time over the last 1 one hour in a line graph. Hover the cursor over a spot on the curve to view the ping response time at the specific time point. To change the report period, click the Last 1 Hour icon on the upper right of the graph, and then select an icon from the list. Available options include Last 6 Hours , Today , Yesterday , This Week , This Month , and This Year .
Performance Counter area fields: Config icon —Click the Config icon . APM populates the Application Instance List with all detected performance counters on the Windows operating system. Select desired performance counters and click OK. APM collects index data of the selected performance counters in the next polling interval. Category—Category of the performance counter.
8 UNIX server monitor APM provides application monitoring and reporting for the following types of UNIX systems: AIX Solaris FreeBSD Mac OS OpenBSD HP-UX AIX AIX can be installed on various types of IBM servers. The performance and stability of AIX greatly affects the performance of applications running on it. APM provides the ability to monitor AIX 5.4 or later versions of the operating system. Adding an AIX application monitor APM monitors the AIX operating system through CLI.
Name—Enter a unique application monitor name. HP recommends using Application name_host IP address for naming the application monitor. Description—Enter a description for the application monitor to aid maintenance. Polling Interval (min)—Select a polling interval for the application monitor. Available options include 1, 2, 3, 4, 5, 10, 20, and 30. The default polling interval is 5 minutes. A shorter polling interval provides more accurate real-time data, but consumes more system resources.
5. Timeout (1-60 seconds)—Enter the maximum time period that APM waits for a Telnet response from AIX. The value range is 1 to 60 seconds and the default is 4 seconds. If no Telnet response is received from AIX within the timeout time, APM considers that the interaction has failed. Contact—Enter user contact information, such as name, email address, and telephone number. The default is the username of the operator who created the application monitor.
Select an Existing Template—Select this option if you want to select an existing SSH template for APM. For information about setting SSH parameter templates, see HP IMC Base Platform Administrator Guide. Authentication Mode—Select the authentication mode for SSH users. Options include Password, Private Key, Password + Private Key, Password + Super Password, Private Key + Super Password, and Password + Private Key + Super Password.
6. Detect Application—Select this parameter if you want to enable application detection. Application detection enables APM to verify connection to the application by using the previous parameter settings, and to modify whether to add the application monitor based on the verification result. APM modifies the application monitor only when it can connect to the application. When this parameter is not selected, APM modifies the application monitor without verifying the connection. Click OK.
Figure 31 Monitor Information area layout Monitor Information area fields: Name—Application monitor name. Health State—Health status of the monitored AIX application. IP Address—IP address of the AIX host. Application Type—Type of the monitored application, which is always AIX. Last Polling Time—Time when APM last polled the AIX application.
Availability pie chart—Shows time duration percentages of the availability states for the AIX application today. The availability states include Available, Unavailable, Inaccessible, and Unmanaged. To view the time duration percentage of a specific availability state, hover the cursor over the corresponding slice in the chart. Current Availability—Availability of the AIX application in the last polling period.
Figure 34 CPU Usage Ratio—Trend graph area layout CPU Usage Ratio area fields: CPU Usage Ratio dashboard or trend graph—View the area in a dashboard or a trend graph. Click the Dashboard icon or Trend icon on the top right corner to switch between the graphs. Dashboard graph—View the CPU usage ratio of the AIX application in the last APM polling period. Trend graph—View the changes of the CPU usage ratio for the AIX application in a line chart.
Figure 35 Memory Usage Ratio—Dashboard area layout Figure 36 Memory Usage Ratio—Trend graph area layout Memory Usage Ratio area fields: Memory Usage Ratio dashboard or trend graph—View the area in a dashboard or a trend graph. Click the Dashboard icon graphs. or Trend icon on the top right corner to switch between the Dashboard graph—View the memory usage ratio of the AIX application in the last APM polling period.
This Month icon , and This Year icon . Click the legend names of the different types of memory usage ratio to display or hide the corresponding monitor indexes. Item—Monitor memory type. Physical memory—Physical memory of AIX, which corresponds to the physical memory bar. Swap—Swap memory of AIX, which corresponds to the disk space. Total—Total amount of the physical or swap memory. In Use—Amount of the physical or swap memory in use.
Ping Test area fields: Response Time trend graph—Shows the trend of the round trip response time of the AIX application over the last 1 hour. Hover the cursor over a spot on the curve to view the response time at the specific time point. To change the report period, click the Last 1 Hour icon on the upper right of the graph, and then select an icon from the list. Available options include Last 6 Hours , Today , Yesterday , This Week , This Month , and This Year .
This Week , This Month , and This Year . Hover the cursor over a spot on the curve to view the system load at the specific time point. Click the legend names to display or hide the corresponding monitor indexes. Attribute/Value—Monitor index name and data that was obtained when APM last polled AIX. System Load/1 Min—Average system load over the last 1 minute. System Load/5 Min—Average system load over the last 5 minutes. System Load/15 Min—Average system load over the last 15 minutes.
the level-1 threshold, and is highlighted in red when the file system usage ratio reaches the level-2 threshold. Use the global thresholds or custom thresholds. For information about setting the thresholds, see "5 Configuration management." In Use—Used space of the file system. History icon —Click the History icon to view the history graph of the file system usage ratio trend. Hover the cursor over a spot on the curve to view the data at the specific time point.
Figure 41 Network Interface area layout Network Interface area fields: Name—Identifier of a network interface card in AIX. APM monitors both physical and virtual (logical) network interface cards. Receive Rate—Receive rate of a network interface card in the last APM polling period. Set Threshold icon —Click the Set Threshold icon to set alarm thresholds for the receive rate of AIX network interface cards.
Figure 42 Error Log area layout Error Log area fields: Time—Time when the error occurred. Log—Content of the error log. More—Click More to view all error logs in last polling of the AIX system. Process To monitor a process on AIX, click the Configuration icon to select the processes to be monitored. APM collects the index data for the monitored processes during the next host polling, which includes the CPU usage ratio and memory usage ratio.
Set Threshold icon —Click the Threshold setting icon to set alarm thresholds of the CPU usage ratio for the monitored process. The data is highlighted in orange when the CPU usage ratio reaches the level-1 threshold, and is highlighted in red when the CPU usage ratio reaches the level-2 threshold. Use the global thresholds or custom thresholds. For information about setting the thresholds, see "5 Configuration management.
To monitor the Solaris application through CLI or SNMP, enable and configure Telnet, SSH, or SNMP on Solaris. For information about enabling Telnet, SSH, or SNMP on Solaris, see the Solaris configuration guide. To monitor the Solaris application through CLI, obtain the correct username and password of the Telnet or SSH user who has the Solaris administrator's privileges. To view traffic statistics in the monitor report of the Solaris application, make sure at least one probe is configured in APM.
Private Key File—Enter the directory of the SSH private key file or browse to the file. Private Key Password—Enter the password to decrypt the SSH private key file. Super Password—Enter the super password with which an SSH user can elevate privileges after login. Port—Enter the SSH port on Solaris. Timeout (1-120 seconds)—Enter the maximum time period that APM waits for an SSH response from Solaris. The value range is 1 to 120 seconds and the default is 10 seconds.
no SNMP response is received from Solaris within the timeout time, APM considers that the interaction has failed. 5. Retries (1-20)—Enter how many times APM retries to send SNMP packets to the Solaris host. Contact—Enter user contact information, such as name, email address, and telephone number. The default is the username of the operator who created the application monitor. Related Applications—Configure the applications that Solaris depends on.
Select an Existing Template—Select this option if you want to select an existing SSH template for APM. For information about setting SSH parameter templates, see HP IMC Base Platform Administrator Guide. Authentication Mode—Select the authentication mode for SSH users. Options include Password, Private Key, Password + Private Key, Password + Super Password, Private Key + Super Password, and Password + Private Key + Super Password.
5. Select an Existing Template—Select this option if you want to select an existing SNMP template for APM. For information about setting SNMP parameter templates, see HP IMC Base Platform Administrator Guide. Parameter Type—Select the SNMP parameter type. Options include SNMPv1, SNMPv2c, and SNMPv3 Template. The SNMPv3 Template option is available only when Select an Existing Template is selected.
Figure 45 Part of a Solaris application monitor report Monitor Information The Monitor Information area layout is shown in Figure 46. Figure 46 Monitor Information area layout Monitor Information area fields: Name—Application monitor name. Health State—Health status of the monitored Solaris application. IP Address—IP address of the Solaris host. Application Type—Type of the monitored application, which is always Solaris.
Figure 47 Available Today area layout Availability Today area fields: Availability pie chart—Shows time duration percentages of the availability states for the Solaris application today. The availability states include Available, Unavailable, Inaccessible, and Unmanaged. To view the time duration percentage of a specific availability state, hover the cursor over the corresponding slice in the chart. Current Availability—Availability of the Solaris application in the last polling period.
Figure 48 CPU Usage Ratio—Dashboard area layout Figure 49 CPU Usage Ratio—Trend graph area layout CPU Usage Ratio area fields: CPU Usage Ratio dashboard or trend graph—View the area in a dashboard or a trend graph. Click the Dashboard icon or Trend icon on the top right corner to switch between the graphs. Dashboard graph—View the CPU usage ratio of the Solaris application in the last APM polling period.
the global thresholds or custom thresholds. For information about setting the thresholds, see "5 Configuration management." History icon —Click the History icon to view the history graph of the CPU usage ratio trend. Hover the cursor over a spot on the curve to view the CPU usage ratio at the specific time point.
Memory Usage Ratio dashboard or trend graph—View the area in a dashboard or a trend graph. Click the Dashboard icon graphs. or Trend icon on the top right corner to switch between the Dashboard graph—View the memory usage ratio of the Solaris application in the last APM polling period. Trend graph—View the changes of the memory usage ratio (including the physical memory usage ratio and swap memory usage ratio) for the Solaris application in a line chart.
Figure 52 Ping Test area layout Ping Test area fields: Response Time trend graph—Shows the trend of the round trip response time of the Solaris application over the last 1 hour. Hover the cursor over a spot on the curve to view the response time at the specific time point. To change the report period, click the Last 1 Hour icon on the upper right of the graph, and then select an icon from the list. Available options include Last 6 Hours , Today , Yesterday , This Week , This Month , and This Year .
Figure 53 System Load area layout System Load area fields: System Load trend graph—Shows the system load trend of Solaris over the last 1 hour. The green curve shows the system load over 1 minute, the orange over 5 minutes, and the blue over 15 minutes. To change the report period, click the Last 1 Hour icon on the upper right of the graph, and then select an icon from the list. Available options include Last 6 Hours , Today , Yesterday , This Week , This Month , and This Year .
Figure 54 File System Usage Ratio area layout File System Usage Ratio area fields: File System Usage Ratio horizontal bar chart—Shows the space usage ratio of each mount point in the last APM polling period. Hover the cursor over a spot in a bar to view the space usage ratio of the specified mount point. File System—Mount point of the file system in the Solaris directory structure. Usage Ratio—Space usage ratio of the file system.
Yesterday , This Week , This Month , and This Year . Hover the cursor over a spot on the curve to view the application traffic at the specific time point. Click Rx or Tx to display or hide the corresponding monitor index in the graph. Attribute/Value—Monitor index name and data that was obtained when APM last polled Solaris. Last Hour's Traffic—Total traffic sent and received by Solaris over the last 1 hour. Today's Traffic—Total traffic sent and received by Solaris since 00:00 today.
Figure 57 Process area layout Process area fields: Configuration icon —Click the Configuration icon in the monitor list window. Process—Name of the monitored process. APM can respectively collect index data for the processes that have the same name, but different in Process Identifier (PID). CPU Usage Ratio—CPU usage ratio of the monitored process in the last APM polling period.
Figure 58 I/O State area layout I/O State area fields: Device Name—Name of the disk drivers in the Solaris system. I/O Read Rate—Size of the input/output data in the disk driver per second. I/O Write Rate—Size of the input data in the disk driver per second. FreeBSD FreeBSD's performance and stability can greatly affect the performance of applications or services running on it. APM provides the ability to monitor FreeBSD 8.2 or later versions of the operating system.
start." APM automatically checks the specified IP address and associates the application monitor with the host managed in the IMC Platform. Name—Enter a unique application monitor name. HP recommends using Application name_host IP address for naming the application monitor. Description—Enter a description for the application monitor to aid maintenance. Polling Interval (min)—Select a polling interval for the application monitor. Available options include 1, 2, 3, 4, 5, 10, 20, and 30.
5. Username—Enter the Telnet username. The user must have the FreeBSD administrator's privilege. Password—Enter the password of the Telnet user. Super Password—Enter the super password with which a Telnet user can elevate privileges after login. Timeout (1-60 seconds)—Enter the maximum time period that APM waits for a Telnet response from FreeBSD. The value range is 1 to 60 seconds and the default is 4 seconds.
Monitor Type—Select the protocol (SSH or Telnet) through which APM monitors the FreeBSD application, and then click the Configure link to configure related parameters. SSH parameters Edit SSH Parameters—Select this option if you want to manually configure SSH parameters for APM. Make sure the SSH settings are the same as those on FreeBSD. Select an Existing Template—Select this option if you want to select an existing SSH template for APM.
6. Contact—Modify the user contact information, such as name, email address, and telephone number. Related Applications—Modify the applications that FreeBSD depends on. Click Add, and then select applications in the popup Select Applications window. Operating system applications, such as Windows, AIX, FreeBSD, OpenBSD, HP-UX, Solaris, Mac OS, and Linux, cannot be selected. The overall dependencies between applications can be viewed in the application topology.
Figure 60 Monitor Information area layout Monitor Information area fields: Name—Application monitor name. Health State—Health status of the monitored FreeBSD application. IP Address—IP address of the FreeBSD host. Application Type—Type of the monitored application, which is always FreeBSD. Last Polling Time—Time when APM last polled the FreeBSD application.
Availability pie chart—Shows time duration percentages of the availability states for the FreeBSD application today. The availability states include Available, Unavailable, Inaccessible, and Unmanaged. To view the time duration percentage of a specific availability state, hover the cursor over the corresponding slice in the chart. Current Availability—Availability of the FreeBSD application in the last polling period.
Figure 63 CPU Usage Ratio—Trend graph area layout CPU Usage Ratio area fields: CPU Usage Ratio dashboard or trend graph—View the area in a dashboard or a trend graph. Click the Dashboard icon or Trend icon on the top right corner to switch between the graphs. Dashboard graph—View the CPU usage ratio of the FreeBSD application in the last APM polling period. Trend graph—View the changes of the CPU usage ratio for the FreeBSD application in a line chart.
Figure 64 Memory Usage Ratio—Dashboard area layout Figure 65 Memory Usage Ratio—Trend graph area layout Memory Usage Ratio area fields: Memory Usage Ratio dashboard or trend graph—View the area in a dashboard or a trend graph. Click the Dashboard icon graphs. or Trend icon on the top right corner to switch between the Dashboard graph—View the memory usage ratio of the FreeBSD application in the last APM polling period.
icon , This Month icon , and This Year icon . Click the legend names of the different types of memory usage ratio to display or hide the corresponding monitor indexes. Item—Monitor memory type. Physical memory—Physical memory of FreeBSD, which corresponds to the physical memory bar. Swap—Swap memory of FreeBSD, which corresponds to the disk space. Total—Total amount of the physical or swap memory. In Use—Amount of the physical or swap memory in use.
Figure 66 Ping Test area layout Ping Test area fields: Response Time trend graph—Shows the trend of the round trip response time of the FreeBSD application over the last 1 hour. Hover the cursor over a spot on the curve to view the response time at the specific time point. To change the report period, click the Last 1 Hour icon on the upper right of the graph, and then select an icon from the list. Available options include Last 6 Hours , Today , Yesterday , This Week , This Month , and This Year .
Figure 67 System Load area layout System Load area fields: System Load trend graph—Shows the system load trend of FreeBSD over the last 1 hour. The green curve shows the system load over 1 minute, the orange over 5 minutes, and the blue over 15 minutes. To change the report period, click the Last 1 Hour icon on the upper right of the graph, and then select an icon from the list. Available options include Last 6 Hours , Today , Yesterday , This Week , This Month , and This Year .
Figure 68 File System Usage Ratio area layout File System Usage Ratio area fields: File System Usage Ratio horizontal bar chart—Shows the space usage ratio of each mount point in the last APM polling period. Hover the cursor over a spot in a bar to view the space usage ratio of the specified mount point. File System—Mount point of the file system in the FreeBSD directory structure. Usage Ratio—Space usage ratio of the file system.
Figure 69 Application Traffic area layout Application Traffic area fields: Application Traffic trend graph—Shows changes of inbound and outbound FreeBSD traffic over the last 1 hour. The green curve shows the inbound traffic and the orange curve shows the outbound traffic. To change the report period, click the Last 1 Hour icon on the upper right of the graph, and then select an icon from the list. Available options include Last 6 Hours , Today , Yesterday , This Week , This Month , and This Year .
Output Error Packet Loss—Number of lost outbound error packets per second on a network interface card in the last APM polling period. Process To monitor a process on FreeBSD, click the Configuration icon to select the processes to be monitored. APM collects the index data for the monitored processes during the next host polling, which includes the CPU usage ratio and memory usage ratio. The monitored processes and the corresponding index data is displayed in the Process area, as shown in Figure 71.
6 hours, today, yesterday, this week, this month, and this year by clicking the corresponding icons. I/O State APM can monitor the I/O status of the disk drivers in the FreeBSD system, as shown in Figure 72. Figure 72 I/O State area layout I/O State area fields: Device Name—Name of the disk drivers in the FreeBSD system. I/O Read Rate—Size of the input/output data in the disk driver per second. I/O Write Rate—Size of the input data in the disk driver per second.
4. Configure the following parameters: IP Address—Enter the IP address of the host on which the Mac OS application to be monitored is installed. If the host is already added to the IMC Platform, you can also click Select and select the host in the Select Devices window. For information about selecting a host, see "2 Quick start." APM automatically checks the specified IP address and associates the application monitor with the host managed in the IMC Platform.
Password, Password + Super/Manager Password (No Operator), Username + Password + Super/Manager Password, No Username + No Password, and Username + No Password. The following parameters to be configured vary with authentication modes. Username—Enter the Telnet username. The user must have the Mac OS administrator's privilege. Password—Enter the password of the Telnet user. Super Password—Enter the super password with which a Telnet user can elevate privileges after login.
Modifying a Solaris application monitor Authorized users can modify all parameters except the IP address of a Solaris application monitor. When the IP address of a monitored Solaris host changes, operators must add a new application monitor for the host. However, the new application monitor cannot inherit the history data from the previous application monitor. To modify a Mac OS application monitor: 1. Click the Resource tab. 2. Select Application Manager > Application Monitor from the navigation tree.
Retries (1-5)—Enter how many times APM retries to send SSH packets to the Mac OS host. Telnet parameters Edit Telnet Parameters—Select this option if you want to manually configure Telnet parameters for APM. Make sure the Telnet settings are the same as those on Mac OS. Select an Existing Template—Select this option if you want to select an existing Telnet template for APM. For information about setting Telnet parameter templates, see HP IMC Base Platform Administrator Guide.
selected. The overall dependencies between applications can be viewed in the application topology. 5. Detect Application—Select this parameter if you want to enable application detection. Application detection enables APM to verify connection to the application by using the previous parameter settings, and to determine whether to modify the application monitor based on the verification result. APM modifies the application monitor only when it can connect to the application.
Figure 74 Monitor Information area layout Monitor Information area fields: Name—Application monitor name. Health State—Health status of the monitored Mac OS application. IP Address—IP address of the Mac OS host. Application Type—Type of the monitored application, which is always Mac OS. Last Polling Time—Time when APM last polled the Mac OS application.
Availability pie chart—Shows time duration percentages of the availability states for the Mac OS application today. The availability states include Available, Unavailable, Inaccessible, and Unmanaged. To view the time duration percentage of a specific availability state, hover the cursor over the corresponding slice in the chart. Current Availability—Availability of the Mac OS application in the last polling period.
Figure 77 CPU Usage Ratio—Trend graph area layout CPU Usage Ratio area fields: CPU Usage Ratio dashboard or trend graph—View the area in a dashboard or a trend graph. Click the Dashboard icon or Trend icon on the top right corner to switch between the graphs. Dashboard graph—View the CPU usage ratio of the Mac OS application in the last APM polling period. Trend graph—View the changes of the CPU usage ratio for the Mac OS application in a line chart.
Figure 78 Memory Usage Ratio—Dashboard area layout Figure 79 Memory Usage Ratio—Trend graph area layout Memory Usage Ratio area fields: Memory Usage Ratio dashboard or trend graph—View the area in a dashboard or a trend graph. Click the Dashboard icon graphs. or Trend icon on the top right corner to switch between the Dashboard graph—View the memory usage ratio of the Mac OS application in the last APM polling period.
icon , This Month icon , and This Year icon . Click the legend names of the different types of memory usage ratio to display or hide the corresponding monitor indexes. Item—Monitor memory type. Physical memory—Physical memory of Mac OS, which corresponds to the physical memory bar. Swap—Swap memory of Mac OS, which corresponds to the disk space. Total—Total amount of the physical or swap memory. In Use—Amount of the physical or swap memory in use.
Figure 80 Ping Test area layout Ping Test area fields: Response Time trend graph—Shows the trend of the round trip response time of the Mac OS application over the last 1 hour. Hover the cursor over a spot on the curve to view the response time at the specific time point. To change the report period, click the Last 1 Hour icon on the upper right of the graph, and then select an icon from the list. Available options include Last 6 Hours , Today , Yesterday , This Week , This Month , and This Year .
Figure 81 System Load area layout System Load area fields: System Load trend graph—Shows the system load trend of Mac OS over the last 1 hour. The green curve shows the system load over 1 minute, the orange over 5 minutes, and the blue over 15 minutes. To change the report period, click the Last 1 Hour icon on the upper right of the graph, and then select an icon from the list. Available options include Last 6 Hours , Today , Yesterday , This Week , This Month , and This Year .
Figure 82 File System Usage Ratio area layout File System Usage Ratio area fields: File System Usage Ratio horizontal bar chart—Shows the space usage ratio of each mount point in the last APM polling period. Hover the cursor over a spot in a bar to view the space usage ratio of the specified mount point. File System—Mount point of the file system in the Mac OS directory structure. Usage Ratio—Space usage ratio of the file system.
Application Traffic APM collects Mac OS traffic based on the IP address of the host where the application resides. The Application Traffic area layout is shown in Figure 40. Figure 83 Application Traffic area layout Application Traffic area fields: Application Traffic trend graph—Shows changes of inbound and outbound Mac OS traffic over the last 1 hour. The green curve shows the inbound traffic and the orange curve shows the outbound traffic.
History icon —Click the History icon to view the history graph of the receive rate trend of a specified network interface card. Hover the cursor over a spot on the curve to view the data at the specific time point. Authorized users can view the receive rate statistics over the last 1 hour, last 6 hours, today, yesterday, this week, this month, and this year by clicking the corresponding icons. Send Rate—Send rate of a network interface card in the last APM polling period.
History icon —Click the History icon to view the history graph of the CPU usage ratio of the monitored process. Hover the cursor over a spot on the curve to view the data at the specific time point. Authorized users can view CPU usage statistics over the last 1 hour, last 6 hours, today, yesterday, this week, this month, and this year by clicking the corresponding icons. Memory Usage Ratio—Memory usage ratio of the monitored process in the last APM polling period.
Select Application Manager > Add Application from the navigation tree. The page displays all application types that can be monitored by APM. 3. Select Application Manager > Application Monitor from the navigation tree, and then click Add on the application monitor list page. Click OpenBSD of the UNIX Server Monitor class. The page for adding an OpenBSD application monitor appears. 4.
5. Edit Telnet Parameters—Select this option if you want to manually configure Telnet parameters for APM. Make sure the Telnet settings are the same as those on OpenBSD. Select an Existing Template—Select this option if you want to select an existing Telnet template for APM. For information about setting Telnet parameter templates, see HP IMC Base Platform Administrator Guide. Authentication Mode—Select the authentication mode for Telnet users.
The page for modifying the OpenBSD application monitor appears. 5. Modify the following parameters: IP Address—Cannot be modified. Name—Modify the unique application monitor name. HP recommends using Application name_host IP address for naming the application monitor. Description—Modify the description for the application monitor to aid maintenance. Polling Interval (min)—Select a polling interval for the application monitor. Available options include 1, 2, 3, 4, 5, 10, 20, and 30, in minutes.
6. Username—Enter the Telnet username. The user must have the OpenBSD administrator's privilege. Password—Enter the password of the Telnet user. Super Password—Enter the super password with which a Telnet user can elevate privileges after login. Timeout (1-60 seconds)—Enter the maximum time period that APM waits for a Telnet response from OpenBSD. The value range is 1 to 60 seconds and the default is 4 seconds.
Figure 87 Part of an OpenBSD application monitor report Monitor Information The Monitor Information area layout is shown in Figure 88. Figure 88 Monitor Information area layout Monitor Information area fields: Name—Application monitor name. Health State—Health status of the monitored OpenBSD application. IP Address—IP address of the OpenBSD host. Application Type—Type of the monitored application, which is always OpenBSD.
Figure 89 Available Today area layout Availability Today area fields: Availability pie chart—Shows time duration percentages of the availability states for the OpenBSD application today. The availability states include Available, Unavailable, Inaccessible, and Unmanaged. To view the time duration percentage of a specific availability state, hover the cursor over the corresponding slice in the chart. Current Availability—Availability of the OpenBSD application in the last polling period.
Figure 90 CPU Usage Ratio—Dashboard area layout Figure 91 CPU Usage Ratio—Trend graph area layout CPU Usage Ratio area fields: CPU Usage Ratio dashboard or trend graph—View the area in a dashboard or a trend graph. Click the Dashboard icon or Trend icon on the top right corner to switch between the graphs. Dashboard graph—View the CPU usage ratio of the OpenBSD application in the last APM polling period.
the global thresholds or custom thresholds. For information about setting the thresholds, see "5 Configuration management." History icon —Click the History icon to view the history graph of the CPU usage ratio trend. Hover the cursor over a spot on the curve to view the CPU usage ratio at the specific time point.
Memory Usage Ratio dashboard or trend graph—View the area in a dashboard or a trend graph. Click the Dashboard icon graphs. or Trend icon on the top right corner to switch between the Dashboard graph—View the memory usage ratio of the OpenBSD application in the last APM polling period. Trend graph—View the changes of the memory usage ratio (including the physical memory usage ratio and swap memory usage ratio) for the OpenBSD application in a line chart.
Figure 94 Ping Test area layout Ping Test area fields: Response Time trend graph—Shows the trend of the round trip response time of the OpenBSD application over the last 1 hour. Hover the cursor over a spot on the curve to view the response time at the specific time point. To change the report period, click the Last 1 Hour icon on the upper right of the graph, and then select an icon from the list. Available options include Last 6 Hours , Today , Yesterday , This Week , This Month , and This Year .
Figure 95 System Load area layout System Load area fields: System Load trend graph—Shows the system load trend of OpenBSD over the last 1 hour. The green curve shows the system load over 1 minute, the orange over 5 minutes, and the blue over 15 minutes. To change the report period, click the Last 1 Hour icon on the upper right of the graph, and then select an icon from the list. Available options include Last 6 Hours , Today , Yesterday , This Week , This Month , and This Year .
Figure 96 File System Usage Ratio area layout File System Usage Ratio area fields: File System Usage Ratio horizontal bar chart—Shows the space usage ratio of each mount point in the last APM polling period. Hover the cursor over a spot in a bar to view the space usage ratio of the specified mount point. File System—Mount point of the file system in the OpenBSD directory structure. Usage Ratio—Space usage ratio of the file system.
Figure 97 Application Traffic area layout Application Traffic area fields: Application Traffic trend graph—Shows changes of inbound and outbound OpenBSD traffic over the last 1 hour. The green curve shows the inbound traffic and the orange curve shows the outbound traffic. To change the report period, click the Last 1 Hour icon on the upper right of the graph, and then select an icon from the list. Available options include Last 6 Hours , Today , Yesterday , This Week , This Month , and This Year .
Output Error Packet Loss—Number of lost outbound error packets per second on a network interface card in the last APM polling period. Process To monitor a process on OpenBSD, click the Configuration icon to select the processes to be monitored. APM collects the index data for the monitored processes during the next host polling, which includes the CPU usage ratio and memory usage ratio.
I/O State APM can monitor the I/O status of the disk drivers in the OpenBSD system, as shown in Figure 100. Figure 100 I/O State area layout I/O State area fields: Device Name—Name of the disk drivers in the OpenBSD system. I/O Rate—Size of the input/output data in the disk driver per second. IOs/Sec—Number of the transfer times in the disk driver per second. A transfer is an I/O request to the physical disk. Multiple logical requests can be integrated into a single I/O request.
the host in the Select Devices window. For information about selecting a host, see "2 Quick start." APM automatically checks the specified IP address and associates the application monitor with the host managed in the IMC Platform. Name—Enter a unique application monitor name. HP recommends using Application name_host IP address for naming the application monitor. Description—Enter a description for the application monitor to aid maintenance.
5. Username—Enter the Telnet username. The user must have the HP-UX administrator's privilege. Password—Enter the password of the Telnet user. Super Password—Enter the super password with which a Telnet user can elevate privileges after login. Timeout (1-60 seconds)—Enter the maximum time period that APM waits for a Telnet response from HP-UX. The value range is 1 to 60 seconds and the default is 4 seconds.
Monitor Type—Select the protocol (SSH or Telnet) through which APM monitors the HP-UX application, and then click the Configure link to configure related parameters. SSH parameters Edit SSH Parameters—Select this option if you want to manually configure SSH parameters for APM. Make sure the SSH settings are the same as those on HP-UX. Select an Existing Template—Select this option if you want to select an existing SSH template for APM.
6. Contact—Modify the user contact information, such as name, email address, and telephone number. Related Applications—Modify the applications that HP-UX depends on. Click Add, and then select applications in the popup Select Applications window. Operating system applications, such as Windows, AIX, FreeBSD, OpenBSD, HP-UX, Solaris, Mac OS, and Linux, cannot be selected. The overall dependencies between applications can be viewed in the application topology.
Figure 102 Monitor Information area layout Monitor Information area fields: Name—Application monitor name. Health State—Health status of the monitored HP-UX application. IP Address—IP address of the HP-UX host. Application Type—Type of the monitored application, which is always HP-UX. Last Polling Time—Time when APM last polled the HP-UX application.
Unmanaged. To view the time duration percentage of a specific availability state, hover the cursor over the corresponding slice in the chart. Current Availability—Availability of the HP-UX application in the last polling period. To view the availability of the HP-UX application in the last 7 days, click the Weekly History icon . The weekly availability data is collected in hours. To view the time duration percentages of availability states at a specific time, hover the cursor over that time.
Figure 105 CPU Usage Ratio—Trend graph area layout CPU Usage Ratio area fields: CPU Usage Ratio dashboard or trend graph—View the area in a dashboard or a trend graph. Click the Dashboard icon or Trend icon on the top right corner to switch between the graphs. Dashboard graph—View the CPU usage ratio of the HP-UX application in the last APM polling period. Trend graph—View the changes of the CPU usage ratio for the HP-UX application in a line chart.
Figure 106 Memory Usage Ratio—Dashboard area layout Figure 107 Memory Usage Ratio—Trend graph area layout Memory Usage Ratio area fields: Memory Usage Ratio dashboard or trend graph—View the area in a dashboard or a trend graph. Click the Dashboard icon graphs. or Trend icon on the top right corner to switch between the Dashboard graph—View the memory usage ratio of the HP-UX application in the last APM polling period.
, This Month icon , and This Year icon . Click the legend names of the different types of memory usage ratio to display or hide the corresponding monitor indexes. Item—Monitor memory type. Physical memory—Physical memory of HP-UX, which corresponds to the physical memory bar. Swap—Swap memory of HP-UX, which corresponds to the disk space. Total—Total amount of the physical or swap memory. In Use—Amount of the physical or swap memory in use.
Ping Test area fields: Response Time trend graph—Shows the trend of the round trip response time of the HP-UX application over the last 1 hour. Hover the cursor over a spot on the curve to view the response time at the specific time point. To change the report period, click the Last 1 Hour icon on the upper right of the graph, and then select an icon from the list. Available options include Last 6 Hours , Today , Yesterday , This Week , This Month , and This Year .
This Week , This Month , and This Year . Hover the cursor over a spot on the curve to view the system load at the specific time point. Click the legend names to display or hide the corresponding monitor indexes. Attribute/Value—Monitor index name and data that was obtained when APM last polled HP-UX. System Load/1 Min—Average system load over the last 1 minute. System Load/5 Min—Average system load over the last 5 minutes. System Load/15 Min—Average system load over the last 15 minutes.
reaches the level-1 threshold, and is highlighted in red when the file system usage ratio reaches the level-2 threshold. Use the global thresholds or custom thresholds. For information about setting thresholds, see "5 Configuration management." History icon —Click the History icon to view the history graph of the file system usage ratio trend. Hover the cursor over a spot on the curve to view the data at the specific time point.
Name—Identifier of a network interface card in HP-UX. APM monitors both physical and virtual (logical) network interface cards. Output Packet Rate—Number of outbound packets per second on the network interface card in the last APM polling period. Set Threshold icon —Click the Set Threshold icon to set alarm thresholds for the output packet rate of HP-UX network interface cards.
Process To monitor the process on HP-UX, click the Configuration icon to select the processes to be monitored. APM collects the index data for the monitored processes during the next host polling, which includes the CPU usage ratio and memory usage ratio. The monitored processes and the corresponding monitored index data is displayed in the Process area, as shown in Figure 114.
6 hours, today, yesterday, this week, this month, and this year by clicking the corresponding icons. I/O State APM can monitor the I/O status of the disk drivers in the HP-UX system, as shown in Figure 115. Figure 115 I/O State area layout I/O State area fields: Device Name—Name of the disk drivers in the HP-UX system. Kilobytes Transferred per Second—Size of the input/output data in the disk driver per second. Number of Seeks per Second—Number of search times in the disk driver per second.
9 Linux server monitor APM permits operators to monitor a Linux application. This chapter describes how to add and modify the Linux application monitor, and how to view the monitor report. Linux Linux is a popular open source operating system that has multiple release versions. APM can monitor the Linux release versions of Ubuntu, RedHat, SUSE, and CentOS. Through monitoring Linux, operators can view how the operating performance of a Linux server affects network applications on the system.
Polling Interval (min)—Select a polling interval for the application monitor. Available options include 1, 2, 3, 4, 5, 10, 20, and 30. The default polling interval is 5 minutes. A shorter polling interval provides more accurate real-time data, but consumes more system resources. Monitor Type—Select the protocol (SSH, SNMP, or Telnet) through which APM monitors the Linux application, and then click the Configure link to configure related parameters.
Telnet response is received from Linux within the timeout time, APM considers that the interaction has failed. SNMP parameters 5. Edit SNMP Parameters—Select this option if you want to manually configure SNMP parameters for APM. Make sure the SNMP settings are the same as those on Linux. Select an Existing Template—Select this option if you want to select an existing SNMP template for APM. For information about setting SNMP parameter templates, see HP IMC Base Platform Administrator Guide.
The page for modifying the Linux application monitor appears. 4. Modify the following parameters: IP Address—Cannot be modified. Name—Modify the unique application monitor name. HP recommends using Application name_host IP address for naming the application monitor. Description—Modify the description for the application monitor. Polling Interval (min)—Select a polling interval for the application monitor. Available options include 1, 2, 3, 4, 5, 10, 20, and 30 in minutes.
Username—Enter the Telnet username. The user must have the Linux administrator's privilege. Password—Enter the password of the Telnet user. Super Password—Enter the super password with which a Telnet user can elevate privileges after login. Timeout (1-60 seconds)—Enter the maximum time period that APM waits for a Telnet response from Linux. The value range is 1 to 60 seconds and the default is 4 seconds.
To access the Linux application monitor report: 1. Click the Resource tab. 2. Select Application Manager > Application Monitor from the navigation tree. The application monitor list page displays all application monitors. 3. Click the link identifying a Linux application monitor. The monitor report of the Linux application appears, as shown in Figure 116. For information about the icons in the monitor report, see "2 Quick start." This section describes the fields in each area of the monitor report.
Top5 Unrecovered Alarm—Latest five unrecovered alarms on the Linux host. The alarm level is identified by color: yellow for minor alarms, orange for major alarms, and red for critical alarms. This field does not appear if no alarm is generated by the Linux application. Availability Today The Availability Today area layout is shown in Figure 118.
Figure 119 CPU Usage Ratio—Dashboard area layout Figure 120 CPU Usage Ratio—Trend graph area layout CPU Usage Ratio area fields: CPU Usage Ratio dashboard or trend graph—View the area in a dashboard or a trend graph. Click the Dashboard icon or Trend icon on the top right corner to switch between the graphs. Dashboard graph—View the CPU usage ratio of the Linux application in the last APM polling period.
the global thresholds or custom thresholds. For information about setting the thresholds, see "5 Configuration management." History icon —Click the History icon to view the history graph of the CPU usage ratio trend. Hover the cursor over a spot on the curve to view the CPU usage ratio at the specific time point.
Dashboard graph—View the memory usage ratio of the Linux application in the last APM polling period. Trend graph—View the changes of the memory usage ratio (including the physical memory usage ratio and swap memory usage ratio) for the Linux application in a line chart. The green line is for the physical memory usage ratio and the orange for the swap memory usage ratio. Hover the cursor over a spot on the curve to view the memory usage ratio at the specific time point.
Figure 123 Ping Test area layout Ping Test area fields: Response Time trend graph—Shows the trend of the round trip response time of the Linux application over the last 1 hour. Hover the cursor over a spot on the curve to view the response time at the specific time point. To change the report period, click the Last 1 Hour icon on the upper right of the graph, and then select an icon from the list. Available options include Last 6 Hours , Today , Yesterday , This Week , This Month , and This Year .
Figure 124 System Load area layout System Load area fields: System Load trend graph—Shows the system load trend of Linux over the last 1 hour. The green curve shows the system load over 1 minute, the orange over 5 minutes, and the blue over 15 minutes. To change the report period, click the Last 1 Hour icon on the upper right of the graph, and then select an icon from the list. Available options include Last 6 Hours , Today , Yesterday , This Week , This Month , and This Year .
Figure 125 File System Usage Ratio area layout File System Usage Ratio area fields: File System Usage Ratio horizontal bar chart—Shows the space usage ratio of each mount point in the last APM polling period. Hover the cursor over a spot in a bar to view the space usage ratio of the specified mount point. File System—Mount point of the file system in the Linux directory structure. Usage Ratio—Space usage ratio of the file system.
list. Available options include Last 6 Hours , Today , Yesterday , This Week , This Month , and This Year . Hover the cursor over a spot on the curve to view the application traffic at the specific time point. Click a legend name to display or hide the corresponding monitor index in the graph. Network Interface The Network Interface area layout is shown in Figure 127. Figure 127 Network Interface area layout Network Interface area fields: Name—Identifier of a network interface card in Linux.
Figure 128 Error Log area layout Error Log area fields: Time—Time when the error occurs. Log—Content of the error log. More—Click More to view all error logs in the last polling. Process The process list is empty by default. The Process area layout is shown in Figure 129. Figure 129 Process area layout Process area fields: Config icon window. —Click the Config icon to select processes to be monitored in the monitor list Process—Name of the monitored process.
process. For example, Apache may generate a lot of httpd processes, and APM collects the CPU usage ratio and the memory usage ratio for each httpd process selected. CPU Usage Ratio—CPU usage ratio of the process in the last APM polling period. History icon —Click the History icon to view the history graph of the CPU usage ratio trend. Hover the cursor over a spot on the curve to view the data at the specific time point.
10 Database server monitor APM supports monitoring the following database servers: SQL Server MySQL Oracle DB2 DBQuery Sybase This chapter describes how to add and modify monitors for these database servers, and how to view the monitor reports. SQL Server SQL Server is a Microsoft developed Database Management System (DBMS). The performance and stability can impact the service applications directly, so APM supports the monitor function to SQL Server.
4. Configure the following parameters: Name—Enter a unique application monitor name. HP recommends using Application name_host IP address format for naming the application monitor. Description—Enter a description for the application monitor. Port—Enter the service port number for the SQL Server, 1433 by default. Traffic Collection Port—Enter the service port number for SQL Server. This field appears only when at least one probe is configured for APM.
2. Select Application Management > Application Monitor from the navigation tree. The page displays all application types that can be monitored by APM. 3. Click the Modify icon for the SQL Server application monitor you want to modify. The page for modifying the SQL Server application monitor appears. 4. Modify the following parameters: Name—Modify the unique application monitor name. HP recommends using Application name_host IP address for naming the application monitor.
2. Select Application Management > Application Monitor from the navigation tree. The application monitor list page displays all application monitors. 3. Click the link identifying an SQL Server application monitor. The monitor report of the SQL Server application appears, as shown in Figure 131. For information about the icons in the monitor report, see "2 Quick start." This section describes the fields in each area of the monitor report.
Relationship icon —Click the Relationship icon to view dependencies between SQL Server and other applications in the dependency topology. For more information about dependency topologies, see "Topology management." Top5 Unrecovered Alarm—Latest five unrecovered alarms on SQL Server host. The alarm level is identified by color: yellow for minor alarms, orange for major alarms, and red for critical alarms. This field does not appear if no alarm is generated by the SQL Server application.
Availability time statistics of a new application monitor are collected since the application monitor was added. An availability time field does not appear when its value is 0. Memory Usage The Memory Usage area layout is shown in Figure 134. Figure 134 Memory Usage area layout Memory Usage area fields: Memory usage trend graph—Shows the memory usage trend of the SQL Server over the last 1 hour in a line chart.
Memory Grants Outstanding—Number of processes that were permitted to use the workspace memory. History icon —Click the History icon to view the history graph of the memory usage trend. Hover the cursor over a spot on the curve to view the memory usage at the specific time point. Authorized users can view memory usage statistics over the last 1 hour, last 6 hours, today, yesterday, this week, this month, and this year by clicking the corresponding icons on the upper right of the graph.
Total Pages—Total number of the pages in the SQL Server buffer, including stolen pages, available pages, and database pages. Database Pages—Number of database pages in the buffer pool. Free Pages—Available pages in the buffer pool. Set Threshold icon —Click the Set Threshold icon to set alarm thresholds for the buffer hit ratio. The specified alarm thresholds appear on the Buffer Hit Ratio trend graph as dotted lines.
Active Connections—Number of connections between the SQL Server and its users. Logins/sec—Number of newly established connections per second. Logouts/sec—Number of terminated connections per second. Set Threshold icon —Click the Set Threshold icon to set alarm thresholds for the connection time. The specified alarm thresholds appear on the Connection Time trend graph as dotted lines.
Cache Pages—Number of the pages that the cache objects were using. The size of each page is 8K. Set Threshold icon —Click the Set Threshold icon to set alarm thresholds for the cache hit ratio. The specified alarm thresholds appear on the Cache Hit Ratio trend graph as dotted lines. The data is highlighted in orange when the cache hit ratio reaches the level-1 threshold, and is highlighted in red when the cache hit ratio reaches the level-2 threshold. Use the global thresholds or custom thresholds.
Lock Timeouts/sec—Number of the lock requests that timed out per second. Number of Deadlocks/sec—Number of the lock requests that resulted in deadlocks per second. Average Wait Time—Average waiting time for each lock request. Set Threshold icon —Click the Set Threshold icon to set alarm thresholds for lock statistics. The specified alarm thresholds appear on the Lock Details trend graph as dotted lines.
Batch Requests/Min—Number of the Transact-SQL command batches that the SQL Server received per minute. High value of this index indicates good throughput. SQL Compilations/Min—Times of SQL compilations per minute. This value is in steady state after the activity of the SQL Server user becomes stable. SQL Recompilations/Min—Times of SQL recompilations per minute. Auto Param Attempts/Min—Times of the auto-parameterization attempts per minute.
History icon —Click the History icon to view the average latch waiting time trend of SQL Server. Hover the cursor over a spot on the curve to view the average latch waiting time at the specific time point. Authorized users can view the average latch waiting time statistics over the last 1 hour, last 6 hours, today, yesterday, this week, this month, and this year by clicking the corresponding icons on the upper right of the graph.
Figure 142 Application Traffic area layout Application Traffic area fields: Application Traffic trend graph—Shows changes of inbound and outbound traffic over the last 1 hour. The green curve shows the inbound traffic and the orange curve shows the outbound traffic. To change the report period, click the Last 1 Hour icon on the upper right of the graph, and then select an icon from the list. Available options include Last 6 Hours , Today , Yesterday , This Week , This Month , and This Year .
Figure 144 Database Details area layout Database Details area fields: Database—Name of the running database in the SQL server when APM last polled the SQL server. "_Total" indicates whole statistic for all databases. Size—Disk space for the database. Transactions—Number of transactions that the database started per minute. Active Transactions—Number of active transactions of the database. Log File—Disk space for the database log files.
Obtain the correct username and password of the user who has the MySQL administrator's privileges. To view traffic statistics in the monitor report of the MySQL application, make sure at least one probe is configured in APM. After a MySQL application monitor is added, APM sends the IP address and service port of the monitored MySQL application to the probes for traffic collection. To add a My SQL application monitor: 1. Click the Resource tab. 2.
Modifying a MySQL application monitor Authorized users can modify all parameters except the IP address of a MySQL application monitor. When the IP address of the MySQL host changes, operators must add a new application monitor for the host. However, the new application monitor cannot inherit the history data from the previous application monitor. To modify a MySQL application monitor: 1. Click the Resource tab. 2. Select Application Management > Application Monitor from the navigation tree.
Viewing MySQL application monitor report After adding the MySQL application monitor, APM collects application index data to calculate its availability and health status. Obtain monitor indexes for MySQL by viewing the monitor report. To access a MySQL application monitor report: 1. Click the Resource tab. 2. Select Application Management > Application Monitor from the navigation tree. The application monitor list page displays all application monitors. 3.
Health State—Health status of the MySQL application. IP Address—IP address of the MySQL host. Application Type—Type of the monitored application, which is always MySQL. Version—MySQL version. Port—Service port of MySQL. Basic Directory—MySQL installation path recorded in MySQL. Data Directory—MySQL data storage directory. Last Polling Time—Time when APM last polled MySQL.
To view the availability of the MySQL application in the last 30 days, click the Monthly History icon . The monthly availability data is collected in days. To view the time duration percentages of availability states on a specific day, hover the cursor over that day. Available Time—Total available time duration of the MySQL application since 00:00 today. Unavailable Time—Total unavailable time duration of the MySQL application since 00:00 today.
today, yesterday, this week, this month, and this year by clicking the corresponding icons on the upper right of the graph on the upper right of the graph. Request Statistics The Request Statistics area layout is shown in Figure 149. Figure 149 Request Statistics area layout Request Statistics area fields: Requests per second trend graph—Shows the changes of connection requests that MySQL received per second over the last 1 hour in a line chart.
Figure 150 Connection Statistics area layout Connection Statistics area field: Request Statistics trend graph—Shows the changes of MySQL connection statistics over the last 1 hour in a line chart. Hover the cursor over a spot on the curve to view the connection statistics at the specific time point. To change the report period, click the Last 1 Hour icon on the upper right of the graph, and then select an icon from the list.
Figure 151 Thread Details area layout Thread Details area fields: Thread Details trend graph—Shows the trend of thread details over the last 1 hour in a line chart. Hover the cursor over a spot on the curve to view the thread details at the specific time point. To change the report period, click the Last 1 Hour icon on the upper right of the graph, and then select an icon from the list. Available options include Last 6 Hours , Today , Yesterday , This Week , This Month , and This Year .
Figure 152 Key Details area layout Key Details area fields: Key Hit Ratio trend graph—Shows the trend of key hit ratio over the last 1 hour in a line chart. Hover the cursor over a spot on the curve to view the key hit ratio at the specific time point. To change the report period, click the Last 1 Hour icon on the upper right of the graph, and then select an icon from the list. Available options include Last 6 Hours , Today , Yesterday , This Week , This Month , and This Year .
Figure 153 Buffer Details area layout Buffer Details area fields: Query Hit Ratio trend graph—Shows the changes of the buffer details in the last 1 hour in a line chart. Hover the cursor over a spot on the curve to view the buffer details at the specific time point. To change the report period, click the Last 1 Hour icon on the upper right of the graph, and then select an icon from the list. Available options include Last 6 Hours , Today , Yesterday , This Week , This Month , and This Year .
Figure 154 Table Lock Statistic area layout Table Lock Statistics area fields: Table Lock Statistics trend graph—Shows the changes of the table lock statistics over the last 1 hour in a line chart. Hover the cursor over a spot on the curve to view table lock statistics per minute at the specific time point. To change the report period, click the Last 1 Hour icon on the upper right of the graph, and then select an icon from the list.
Figure 155 SQL Operation Statistics/min area layout SQL Operation Statistics/min area fields: SQL Operation Statistics/min trend graph—Shows the trend of the My SQL executing the Delete, Insert, Select, and Update statements per minute over the last 1 hour in a line chart. Hover the cursor over a spot on the curve to view the SQL operation statistics at the specific time point. To change the report period, click the Last 1 Hour icon on the upper right of the graph, and then select an icon from the list.
Figure 156 Application Traffic area layout Application Traffic area fields: Application Traffic trend graph—Shows changes of inbound and outbound traffic over the last 1 hour. The green curve shows the inbound traffic and the orange curve shows the outbound traffic. To change the report period, click the Last 1 Hour icon on the upper right of the graph, and then select an icon from the list. Available options include Last 6 Hours , Today , Yesterday , This Week , This Month , and This Year .
Oracle Oracle is an Oracle Corporation developed DBMS. The performance and stability can impact the service applications directly, so APM supports the monitor function to Oracle. APM can monitor Oracle 8.x, 9i, 10g, and 11g versions, and supports Oracle stand-alone and RAC. Adding an Oracle application monitor APM monitors the Oracle through the service port (1521 by default).
5. Database Instance Name—Enter the instance name for the stand-alone mode, or enter the service name for the rac mode. Username—Enter the user of the Oracle administrator. If the username is sys, enter "sys as sysdba" in this field. Password—Enter the password of the Oracle administrator. Contact—Enter contact information, such as name, email address, and telephone number. The default is the username of the operator who created the application monitor.
5. Database Instance Name—Enter the instance name for the stand-alone mode, or enter the service name for the rac mode. Username—Modify the username of the Oracle administrator. If the username is sys, enter "sys as sysdba" in this field. Password—Modify the password of the Oracle administrator. Contact—Modify user contact information, such as name, email address, and telephone number. The default is the username of the operator who created the application monitor.
Figure 158 Part of an Oracle application monitor report Monitor Information The Monitor Information area layout is shown in Figure 159. Figure 159 Monitor Information area layout Monitor Information area fields: Name—Application monitor name. Health State—Health status of the Oracle application. IP Address—IP address of the Oracle host. Application Type—Type of the monitored application, which is always Oracle. Oracle Version—Version of Oracle.
Top5 Unrecovered Alarm—Latest five unrecovered alarms on the Oracle host. The alarm level is identified by color: yellow for minor alarms, orange for major alarms, and red for critical alarms. This field does not appear if no alarm is generated by Oracle. Availability Today The Availability Today area layout is shown in Figure 160.
Figure 161 Database Details area layout Database Details area field: Creation Time—Time when Oracle installation was completed. Open Mode—Current open mode for Oracle. Open Modes include READ ONLY and READ WRITE. Logging Mode—Current logging mode for Oracle. The logging modes include the following types: ARCHIVELOG—Old log files are automatically copied to a specified path and cannot overwritten by new log files during the log file switch.
Figure 162 Connection Time area layout Connection Time area fields: Connection Time trend graph—Shows the changes of the connection time over the last 1 hour in a line chart. Hover the cursor over a spot on the curve to view the connection time at the specific time point. To change the report period, click the Last 1 Hour icon on the upper right of the graph, and then select an icon from the list. Available options include Last 6 Hours , Today , Yesterday , This Week , This Month , and This Year .
Figure 163 SGA State area layout SGA State area fields: SGA State bar chart—Shows the hit ratio of each SGA cache when APM last polled Oracle in a bar chart. To view the hit ratio of the cache, hover the cursor over the proper bar. Attribute/Value—Monitor index name and data that was obtained when APM last polled Oracle. Buffer Hit Ratio—How often the required information has been found in the buffer cache.
Figure 164 SGA Details area layout SGA Details area fields (Values were obtained when APM last polled Oracle.): Buffer—Size of buffer cache in SGA. Fixed Area—Size of the fixed area in SGA. The fixed area, usually in small size, contains control information for other SGA regions. REDO Log Buffer—Size of the redo log buffer in SGA. Shared Pool—Size of the shared pool in SGA. Database Buffer—Size of the library cache in SGA. Dictionary Buffer—Size of the dictionary cache in SGA.
select an icon from the list. Available options include Last 6 Hours , Today , Yesterday , This Week , This Month , and This Year . Hover the cursor over a spot on the curve to view the application traffic at the specific time point. Click Rx or Tx to display or hide the corresponding monitor index in the graph. Attribute/Value—Monitor index name and data that was obtained when APM last polled Oracle. Last Hour's Traffic—Total traffic sent and received by Oracle over the last 1 hour.
Figure 167 Tablespace Details area layout Tablespace Details area fields: Tablespace—Tablespace name. Allocated Bytes—Tablespace size when APM last polled Oracle. Allocated Blocks—Number of the data blocks in the tablespace when APM last polled Oracle. Data Files—Number of the datafiles in the table space when APM last polled Oracle. State The State area layout is shown in Figure 168. Figure 168 State area layout State area fields: Tablespace—Tablespace name.
Performance Index area fields: Data File—Name and path of the Oracle datafile. Tablespace—Tablespace where the datafile is located. One datafile locates in only one tablespace. State—Datafile state when APM last polled Oracle. Size—Size of the datafile when APM last polled Oracle. Reads—Times of reading the data from the datafile when APM last polled Oracle. Writes—Times of writing the data to the datafile when APM last polled Oracle.
Submit—Times of the user executing the commit operations during the session when APM last polled Oracle. Cursor—Number of cursors that the user used in the session when APM last polled Oracle. Buffer Hit Ratio—How often the logical reading have occurred in the buffer pool. More—Click More to view more details about the session. Waiting Sessions The Waiting Sessions area layout is shown in Figure 171.
Obtain the correct username and password of the user who has the DB2 administrator's privileges. To view traffic statistics in the monitor report of the DB2 application, make sure at least one probe is configured in APM. After a DB2 application monitor is added, APM sends the IP address and service port of the monitored DB2 application to the probes for traffic collection. To add a DB2 application monitor: 1. Click the Resource tab. 2.
Modifying a DB2 application monitor Authorized users can modify all parameters except the IP address of a DB2 application monitor. When the IP address of a monitored DB2 host changes, operators must add a new application monitor for the host. However, the new application monitor cannot inherit the history data from the previous application monitor. To modifying a DB2 application monitor: 1. Click the Resource tab. 2. Select Application Manager > Application Monitor from the navigation tree.
Viewing the DB2 application monitor report After adding the DB2 application monitor, APM collects application index data to calculate its availability and health status. Obtain monitor indexes for DB2 by viewing the monitor report. To access the DB2 application monitor report: 1. Click the Resource tab. 2. Select Application Manager > Application Monitor from the navigation tree. The application monitor list page displays all application monitors. 3.
IP Address—IP address of the DB2 host. Application Type—Type of the monitored application, which is always DB2. Instance Version—DB2 version. Port—Service port of DB2, 50000 by default. Database Status—State of the database when APM last polled DB2. Last Polling Time—Time when APM last polled DB2. Relationship icon —Click the Related Applications icon to view relations between applications in a dependency topology view.
Availability time statistics of a new application monitor are collected since the application monitor was added. An availability time field does not appear when its value is 0. Connection Statistics The Connection Statistics area layout is shown in Figure 175. Figure 175 Connection Statistics area layout Connection Statistics area fields: Connection Statistics trend graph—Shows the trend of DB2 connection statistics over the last 1 hour in a line chart.
Figure 176 Response Time area layout Response Time area fields: Response Time trend graph—Shows the changes of DB2 response time over the last 1 hour in a line chart. Hover the cursor over a spot on the curve to view the DB2 response time at the specific time point. To change the report period, click the Last 1 Hour icon on the upper right of the graph, and then select an icon from the list. Available options include Last 6 Hours , Today , Yesterday , This Week , This Month , and This Year .
Figure 177 Agent Statistics area layout Agent Statistics area fields: Agent Statistics trend graph—Shows the changes of agent statistics over the last 1 hour in a line chart. Hover the cursor over a spot on the curve to view the agent statistics at the specific time point. To change the report period, click the Last 1 Hour icon on the upper right of the graph, and then select an icon from the list. Available options include Last 6 Hours , Today , Yesterday , This Week , This Month , and This Year .
Free Bytes (%)—Ratio of the available space to the total space in the tablespace when APM last polled DB2. Database Information The Database Information area layout is shown in Figure 179. Figure 179 Database Information area layout Database Information area fields: Database Name—Name of the database. Alias—Alias of the database. Path—Complete path for storing the database in the operating system. Status—Database state when APM last polled DB2.
Figure 181 Cache Performance area layout Cache Performance area fields: Database Name—Name of the database. Package Cache Hit Ratio—How often the required request sections have been found in the package cache. Catalog Cache Hit Ratio—How often the required table descriptors have been found in the catalog cache. Application Traffic APM collects DB2 traffic based on the IP address of the host and the traffic collection port used by the application.
Figure 183 Buffer Statistics area layout Buffer Statistics area fields: Database Name—Name of the database. Direct Reads—Number of the reading operations that do not use the buffer pool. Direct Writes—Number of the writing operations that do not use the buffer pool. Buffer Pool Hit Ratio—How often the required pages have been found in the buffer pool. Index Page Hit Ratio—How often the required index pages have been found in the buffer pool.
Sybase (TCP 5000) SQL Server (TCP 1433) Adding a DBQuery application monitor APM monitors the DBQuery application through the port (5000 by default). When you add application monitors for DBQuery, follow these guidelines: Add DBQuery hosts to the IMC Platform so APM can obtain and display network connections of the hosts and their access devices in the application topology. For more information about adding hosts to the IMC Platform, see HP IMC Base Platform Administrator Guide.
5. Enter the database name for MySQL, DB2, Sybase, and SQL Server that uses the default instance. Enter the Oracle instance name for Oracle database. Enter the database name and instance name separated by semicolon for SQL Server that uses the non-default instance. SQL Statement—Enter the SQL statement. Contact—Enter the contact information, such as name, email address, and telephone number. The default is the username of the operator who created the application monitor.
5. Database Type—Modify the database type. Options include MySQL, Oracle, DB2, Sybase, and SQL Server. Database Instance Name—Modify the database name or instance name. Modify the database name for MySQL, DB2, Sybase, and SQL Server that uses the default instance. Modify the Oracle instance name for Oracle database. Modify the database name and instance name separated by semicolon for SQL Server that uses the non-default instance. SQL Statement—Modify the SQL statement.
Figure 185 Part of a DBQuery application monitor report The following subsections describe the areas of the monitor report. Monitor Information The Monitor Information area layout is shown in Figure 186. Figure 186 Monitor Information area layout Name—Application monitor name. Health State—Health status of the DBQuery application. IP Address—IP address of the DBQuery host. Application Type—Type of the monitored application, which is always DBQuery.
Availability Today The Availability Today area layout is shown in Figure 187. Figure 187 Availability Today area layout Availability Today area fields: Availability pie chart—Shows time duration percentages of the availability states for the DBQuery application today. The availability states include Available, Unavailable, Inaccessible, and Unmanaged. To view the time duration percentage of a specific availability state, hover the cursor over the corresponding slice in the chart.
Figure 188 Response Time area layout Response Time area fields: Response Time trend graph—Shows changes of the response time by DBQuery over the last 1 hour in a line chart. Hover the cursor over a spot on the curve to view the response time at the specific time point. To change the report period, click the Last 1 Hour icon on the upper right of the graph, and then select an icon from the list. Available options include Last 6 Hours , Today , Yesterday , This Week , This Month , and This Year .
Figure 189 Query Result area layout The Query Result area displays 10 entries. Click More to bring up the query result window. A maximum of 200 entries can be displayed. Sybase Sybase is an IBM Corporation developed DBMS. The performance and stability can impact the service applications directly, so APM supports the monitor function to Sybase. Adding a Sybase application monitor APM monitors the Sybase application through the port.
Name—Enter a unique application monitor name. HP recommends using Application name_host IP address for naming the application monitor. Description—Enter a description for the application monitor. Port—Enter the port number for the application monitor. The default port is TCP 5000. Traffic Collection Port—Enter one or more service port numbers for Sybase. To set multiple ports, separate the port numbers by commas. This field appears only when at least one probe is configured for APM.
Name—Modify the unique application monitor name. HP recommends using Application name_host IP address for naming the application monitor. Description—Modify a description for the application monitor. Port—Modify the port number for the application monitor. The default is TCP 5000. Traffic Collection Port—Modify one or more service port numbers for Sybase. To set multiple ports, separate the port numbers by commas. This field appears only when at least one probe is configured for APM.
Figure 190 Part of a Sybase application monitor report The following subsections describe the areas of the monitor report. Monitor Information The Monitor Information area layout is shown in Figure 191. Figure 191 Monitor Information area layout Monitor Information area fields: Name—Application monitor name. Health State—Health status of the Sybase application. IP Address—IP address of the Sybase host. Application Type—Type of the monitored application, which is always Sybase.
Figure 192 Availability Today area layout Availability Today area fields: Availability pie chart—Shows time duration percentages of the availability states for the Sybase application today. The availability states include Available, Unavailable, Inaccessible, and Unmanaged. To view the time duration percentage of a specific availability state, hover the cursor over the corresponding slice in the chart. Current Availability—Availability of the Sybase application in the last polling period.
Figure 193 Memory Details area layout Memory Details area fields: Memory Usage trend graph—Shows changes of the memory usage by Sybase over the last 1 hour in a line chart. Hover the cursor over a spot on the curve to view the memory usage at the specific time point. To change the report period, click the Last 1 Hour icon on the upper right of the graph, and then select an icon from the list. Available options include Last 6 Hours , Today , Yesterday , This Week , This Month , and This Year .
Response Time The Monitor Information area layout is shown in Figure 194. Figure 194 Monitor Information area layout Response Time area fields: Response Time trend graph—Shows changes of the response time by Sybase over the last 1 hour in a line chart. Hover the cursor over a spot on the curve to view the response time at the specific time point. To change the report period, click the Last 1 Hour icon on the upper right of the graph, and then select an icon from the list.
Figure 195 Connection Statistics area layout Connection Statistics area fields: Connection Statistics trend graph—Shows changes of the connections and remote connections used by Sybase over the last 1 hour in a line chart. Hover the cursor over a spot on the curve to view the number of connections and remote connections at the specific time point. To change the report period, click the Last 1 Hour icon on the upper right of the graph, and then select an icon from the list.
Application Traffic trend graph—Shows changes of inbound and outbound traffic over the last 1 hour. The green curve shows the inbound traffic and the orange curve shows the outbound traffic. To change the report period, click the Last 1 Hour icon on the upper right of the graph, and then select an icon from the list. Available options include Last 6 Hours , Today , Yesterday , This Week , This Month , and This Year .
Time Blocked—Duration for how long the process is blocked. More—Click More to display all processes that accessed the Sybase. Transaction Details The Transaction Details area layout is shown in Figure 199. Figure 199 Transaction Details area layout Transaction Details area fields: Process Name—Name of the processes that were using transactions to access the database. Database Name—Name of the database the process accessed. Type—Type of the running transaction.
11 Application server monitor APM supports monitoring the following application servers: .NET server JBoss server Tomcat server Oracle Application Server WebLogic server GlassFish server WebSphere server This chapter describes how to add/modify monitors for these application servers, and helps you view the monitor reports. .NET server Microsoft .NET server is an XML Web Service platform for the Web applications developed by the .NET technology.
IP Address—Enter the IP address of the host on which the .NET server application to be monitored resides. If the host is already added to the IMC Platform, you can also click Select and select the host in the Select Devices window. For information about selecting a host, see "2 Quick start." APM automatically checks the specified IP address and associates the application monitor with the host managed in the IMC Platform. Name—Enter a unique application monitor name.
The page for modifying the .NET server application monitor appears. 4. Modify the following parameters: IP Address—Cannot be modified. Name—Modify the unique application monitor name. HP recommends that you use Application name_host IP address for naming the application monitor. Description—Modify the description for the application monitor. Polling Interval (min)—Select a polling interval for the application monitor. Available options include 1, 2, 3, 4, 5, 10, 20, and 30.
Figure 200 Part of an .NET server application monitor report Monitor Information The Monitor Information area layout is shown in Figure 201. Figure 201 Monitor Information area layout Monitor Information area fields: Name—Application monitor name. Health State—Health state of the .NET server application. IP Address—IP address of the .NET server host. Application Type—Type of the monitored application, which is always .NET Server. Last Polling Time—Time when APM last polled the .
Figure 202 Availability Today area layout Availability Today area fields: Availability pie chart—Shows time duration percentages of the availability states for the .NET server today. The availability states include Available, Unavailable, Inaccessible, and Unmanaged. To view the time duration percentage of a specific availability state, hover the cursor over the corresponding slice in the chart. Current Availability—Availability of the .NET server in the last polling period.
Figure 203 .NET Memory area layout .NET Memory area fields: CPU usage in GC trend graph—Shows the CPU usage trend of GC over the selected time period in a line graph. Hover the cursor over a spot in the curve to view the CPU usage of GC at the specific time point. By default, the graph shows the last 1 hour data. To change the report period, click the Last 1 Hour icon on the upper right of the graph, and then select an icon from the list.
Figure 204 .NET Thread area layout .NET Thread area fields: .NET threads trend graph—Shows changes of the numbers of physical threads and logical threads of the .NET server over the last 1 hour. To change the report period, click the Last 1 Hour icon on the upper right of the graph, and then select an icon from the list. Available options include Last 6 Hours , Today , Yesterday , This Week , This Month , and This Year .
.NET Abnormality The .NET Abnormality area layout is shown in Figure 205. Figure 205 .NET Abnormality area layout .NET Abnormality area fields: Thrown abnormalities trend graph—Shows changes of the number of thrown abnormalities over the selected time period in a line graph. Hover the cursor over a spot on the curve to view the number of thrown abnormalities at the specific time point. By default, the graph shows the last 1 hour data.
Figure 206 Just In Time (JIT) is the .NET framework compiler which converts the Microsoft Intermediate Language (MSIL) to native code on an as needed basis. CPU usage is a major indicator of JIT. JIT area layout JIT area fields: CPU usage in JIT trend graph—Shows the CPU usage trend of JIT over the selected time period in a line graph. Hover the cursor over a spot on the curve to view the CPU usage at the specific time point. By default, the graph shows the last 1 hour data.
right of the graph, and then select an icon from the list. Available options include Last 6 Hours , Today , Yesterday , This Week , This Month , and This Year . Attribute/Value—Monitor index name and data. Total Checks During Runtime—Total number of runtime Code Access Security (CAS) checks performed by the .NET server since the server started in the last polling interval. History icon —Click the History icon to view history graph of the total runtime check trend.
Configuring the JBoss server APM monitors the JBoss server using JMX. The default JMX port is TCP 1009. Before you monitor a JBoss server, complete the following tasks: 1. Edit the startup parameters for the JBoss server. By default, a JBoss server of version 4.2 or later versions only listens on the port with the IP address of 127.0.0.1 (local host). To enable APM to obtain index data from the JBoss server, add the parameter –b 0.0.0.
Description—Enter a description for the application monitor. Port—Enter the listening port of JMX. The default setting is TCP 1099. 5. Traffic Monitor Port—Enter the port used by the JBoss server to provide services. The parameter appears only after a traffic probe is configured in APM. Polling Interval (min)—Select a polling interval for the application monitor. Available options include 1, 2, 3, 4, 5, 10, 20, and 30. The default polling interval is 5 minutes.
5. Traffic Monitor Port—Modify the port used by the JBoss server to provide services. This parameter appears only when at least one probe is configured for APM. Polling Interval (min)—Select a polling interval for the application monitor. Available options include 1, 2, 3, 4, 5, 10, 20, and 30. The default polling interval is 5 minutes. A shorter polling interval provides more accurate real-time data consumes more system resources.
Figure 209 Part of an JBoss server application monitor report Monitor Information The Monitor Information area layout is shown in Figure 210. Figure 210 Monitor Information area layout Monitor Information area fields: Name—Application monitor name. Health State—Health state of the JBoss server application. IP Address—IP address of the JBoss server host. Application Type—Type of the monitored application, which is always JBoss Server. JBoss Version—Version of the JBoss server.
Figure 211 Availability Today area layout Availability Today area fields: Availability pie chart—Shows time duration percentages of the availability states for the JBoss server today. The availability states include Available, Unavailable, Inaccessible, and Unmanaged. To view the time duration percentage of a specific availability state, hover the cursor over the corresponding slice in the chart. Current Availability—Availability of the JBoss server in the last polling period.
Figure 212 Memory Usage area layout Memory Usage area fields: Memory usage trend graph—Shows the memory usage trend of the JBoss server over the selected time period in a line graph. Hover the cursor over a spot in the curve to view the memory usage at the specific time point. By default, the graph shows the last 1 hour data. To change the report period, click the Last 1 Hour icon on the upper right of the graph, and then select an icon from the list.
Figure 213 Stack area layout Stack area fields: Current stacks trend graph—Shows changes of the current stack size over the selected time period in a line chart. Hover the cursor over a spot on the curve to view the stack size at the specific time point. By default, the graph shows the last 1 hour data. To change the report period, click the Last 1 Hour icon on the upper right of the graph, and then select an icon from the list.
Figure 214 Connection Pool area layout Connection Pool area fields: Connections in use trend graph—Shows changes of the number of connections in use over the selected time period in a line graph. Hover the cursor over a spot on the curve to view the number of connections in use at the specific time point. By default, the graph shows the last 1 hour data. To change the report period, click the Last 1 Hour icon on the upper right of the graph, and then select an icon from the list.
Web Application The Web Application area is as shown in Figure 215. Figure 215 Web Application area layout Web Application area fields: Web Application—Name of the Web application deployed on the JBoss server. Servlet—Servlet used by the Web application. One Web application can use multiple servlets, each responsible for responding to and handling HTTP requests of one or multiple Web pages.
Figure 216 Application Traffic area layout Application Traffic area fields: Application Traffic trend graph—Shows changes of inbound and outbound traffic over the last 1 hour. The green curve shows the inbound traffic and the orange curve shows the outbound traffic. To change the report period, click the Last 1 Hour icon on the upper right of the graph, and then select an icon from the list. Available options include Last 6 Hours , Today , Yesterday , This Week , This Month , and This Year .
2. Add the following java options to the Tomcat startup script: set JAVA_OPTS=%JAVA_OPTS% -Dcom.sun.management.jmxremote -Dcom.sun.management.jmxremote.port=1099 -Dcom.sun.management.jmxremote.ssl=false -Dcom.sun.management.jmxremote.authenticate=false -Djava.rmi.server.hostname=172.8.21.1. For Windows operating systems, the startup script path is \bin\catalina.bat. For Linux operating systems, directory>/bin/catalina.sh.
address and service port of the monitored Tomcat server application to the probes for traffic collection. To add a Tomcat server application monitor: 1. Click the Resource tab. 2. Enter the Add Application page in one of the following ways: Select Application Manager > Add Application from the navigation tree. The page displays all application types that can be monitored by APM. 3.
Modifying a Tomcat server application monitor Authorized users can modify all parameters except the IP address of a Tomcat server application monitor. When the IP address of the monitored Tomcat server host changes, add a new application monitor for the host. However, the new application monitor cannot inherit the history data from the previous application monitor. To modify a Tomcat server application monitor: 1. Click the Resource tab. 2.
Viewing the Tomcat server application monitor report After adding a Tomcat server application monitor, APM collects application index data to calculate its availability and health status. Obtain monitor indexes for Tomcat server by viewing the monitor report. To access the Tomcat server application monitor report: 1. Click the Resource tab. 2. Select Application Manager > Application Monitor from the navigation tree. The application monitor list page displays all application monitors. 3.
Application Type—Type of the monitored application, which is always Tomcat Server. Tomcat Version—Version of the Tomcat server. Last Polling Time—Time when APM last polled the Tomcat server application. Relationship icon —Click the Relationship icon to view dependencies between applications in a dependency topology view. For more information about dependency topologies, see "Topology management." Top5 Unrecovered Alarm—Latest five unrecovered alarms on the Tomcat server.
Availability time statistics of a new application monitor are collected since 00:00 on the day when the application monitor was added. An availability time field does not appear if its value is 0. Performance The Performance area layout is shown in Figure 220. Figure 220 Performance area layout Performance area fields: Response time trend graph—Shows changes of the response time of the Tomcat server over the selected time period in a line graph.
Figure 221 Memory Usage area layout Memory Usage area fields: Memory usage trend graph—Shows the memory usage trend of the Tomcat server over the selected time period in a line graph. The green curve shows the total memory and the orange curve shows the used memory. Hover the cursor over a spot in the curve to view the memory usage at the specific time point. By default, the graph shows the last 1 hour data.
Figure 222 Application Traffic area layout Application Traffic area fields: Application Traffic trend graph—Shows changes of inbound (Rx) and outbound (Tx) traffic over the last 1 hour. The green curve shows the inbound traffic and the orange curve shows the outbound traffic. To change the report period, click the Last 1 Hour icon on the upper right of the graph, and then select an icon from the list. Available options include Last 6 Hours , Today , Yesterday , This Week , This Month , and This Year .
highlighted in red when it reaches the level-2 threshold. Use either the global thresholds or custom thresholds. For more information about threshold setting, see "Threshold Management." History icon —Click the History icon for a monitor index to view history trend statistics of the total requests, successes, or errors in a line graph. Hover the cursor over a spot on the curve to view the data at the specific time point.
Configuring the Oracle Application Server APM monitors the Oracle Application Server through the Dynamic Monitoring Service (DMS) provided by the Oracle Application Server. For this reason, the DMS must be made accessible to the APM server. To enable the access, complete the following tasks: 1.
4. Configure the following parameters: Name—Enter a unique application monitor name. HP recommends using Application name_host IP address for naming the application monitor. Description—Enter a description for the application monitor. Port—Enter the DMS listening port. 5. IP Address—Enter the IP address of the host on which the Oracle AS to be monitored resides.
4. Modify the following parameters: Name—Modify the unique application monitor name. HP recommends that you use Application name_host IP address for naming the application monitor. Description—Modify the description for the application monitor. Port—Modify the DMS listening port. 5. IP Address—Cannot be modified. Traffic Collection Port—Modify the service port number of the Oracle AS. This field appears only when at least one probe is configured for APM.
Figure 226 Part of an Oracle AS application monitor report Monitor Information The Monitor Information area layout is shown in Figure 227. Figure 227 Monitor Information area layout Monitor Information area fields: Name—Application monitor name. Health State—Health state of the Oracle AS application. IP Address—IP address of the Oracle AS host. Application Type—Type of the monitored application, which is always Oracle AS.
Figure 228 Availability Today area layout Availability Today area fields: Availability pie chart—Shows time duration percentages of the availability states for the Oracle AS today. The availability states include Available, Unavailable, Inaccessible, and Unmanaged. To view the time duration percentage of a specific availability state, hover the cursor over the corresponding slice in the chart. Current Availability—Availability of the Oracle AS in the last polling period.
Figure 229 Response Time area layout Response Time area fields: Response time trend graph—Shows changes of the response time of the Oracle AS over the selected time period in a line graph. Hover the cursor over a spot in the curve to view the response time at the specific time point. By default, the graph shows the last 1 hour data. To change the report period, click the Last 1 Hour icon on the upper right of the graph, and then select an icon from the list.
Figure 230 OPMN Memory Details area layout OPMN Memory Details area fields: Memory usage trend graph—Shows the memory usage trend of the OPMN over the selected time period in a line graph. Hover the cursor over a spot in the curve to view the memory usage data at the specific time point. By default, the graph shows the last 1 hour data. To change the report period, click the Last 1 Hour icon on the upper right of the graph, and then select an icon from the list.
traffic. To change the report period, click the Last 1 Hour icon on the upper right of the graph, and then select an icon from the list. Available options include Last 6 Hours , Today , Yesterday , This Week , This Month , and This Year . Hover the cursor over a spot on the curve to view the application traffic at the specific time point. Click Rx or Tx to display or hide the corresponding monitor index in the graph.
Figure 233 Web Application Details area layout Web Application Details area fields: Module Name—Module name of the Web application. Application Name—Name of the Web application. OC4J Instance Name—Name of the OC4J instance to which the Web application is deployed. Requests Per Second—Number of requests per second received by the Web application. Requests Completed—Total number of requests processed by the Web application since the Oracle AS started in the last polling interval.
EJB Name—Name of the EJB. EAR Name—Name of the EAR file that the EJB is packaged in. Process—Source process of the EJB. Type—Type of the EJB, which can be Stateful, Stateless, or Message. Pooled Instances—Total number of instances in Pooled state in the last polling interval. Ready Instances—Total number of instances in Ready state in the last polling interval. Passive Instances—Total number of instances in Passive state in the last polling interval.
Description—Enter a description for the application monitor. Port—Enter the JMX port. 5. Name—Enter a unique application monitor name. HP recommends using Application name_host IP address for naming the application monitor. Traffic Collection Port—Enter the service port number of the WebLogic server. This field appears only when at least one probe is configured for APM. Polling Interval (min)—Select a polling interval for the application monitor.
Description—Modify the description for the application monitor. Port—Modify the JMX port. 5. Traffic Collection Port—Modify the service port number of the WebLogic server. This field appears only when at least one probe is configured for APM. Polling Interval (min)—Select a polling interval for the application monitor. Available options include 1, 2, 3, 4, 5, 10, 20, and 30. The default polling interval is 5 minutes.
Figure 235 Part of a WebLogic server application monitor report Monitor Information The Monitor Information area layout is shown in Figure 236. Figure 236 Monitor Information area layout Monitor Information area fields: Name—Application monitor name. Health State—Health state of the WebLogic server application. IP Address—IP address of the WebLogic server host. Application Type—Type of the monitored application, which is always WebLogic Server. Version—Version of the WebLogic server.
Figure 237 Availability Today area layout Availability Today area fields: Availability pie chart—Shows time duration percentages of the availability states for the WebLogic server today. The availability states include Available, Unavailable, Inaccessible, and Unmanaged. To view the time duration percentage of a specific availability state, Hover the cursor over the corresponding slice in the chart. Current Availability—Availability of the WebLogic server in the last polling period.
Figure 238 JVM Heap Memory Details area layout JVM Heap Memory Details area fields: JVM heap memory usage trend graph—Shows the JVM heap memory usage trend of the WebLogic server over the selected time period in a line graph. Hover the cursor over a spot in the curve to view the JVM heap memory usage statistics at the specific time point. By default, the graph shows the last 1 hour data.
Figure 239 Thread area layout Thread area fields: Used thread count trend graph—Shows changes of the used thread count of the WebLogic server over the selected time period in a line chart. Hover the cursor over a spot on the curve to view the thread count at the specific time point. By default, the graph shows the last 1 hour data. To change the report period, click the Last 1 Hour icon on the upper right of the graph, and then select an icon from the list.
Figure 240 Response Time area layout Response Time area fields: Response time trend graph—Shows changes of the response time of the WebLogic server over the selected time period in a line graph. Hover the cursor over a spot in the curve to view the response time at the specific time point. By default, the graph shows the last 1 hour data. To change the report period, click the Last 1 Hour icon on the upper right of the graph, and then select an icon from the list.
Application Traffic trend graph—Shows changes of inbound (Rx) and outbound (Tx) traffic over the last 1 hour. The green curve shows the inbound traffic and the orange curve shows the outbound traffic. To change the report period, click the Last 1 Hour icon on the upper right of the graph, and then select an icon from the list. Available options include Last 6 Hours , Today , Yesterday , This Week , This Month , and This Year .
Name—Name of the servlet. Invoke Count—Number of times that the servlet had been invoked since the WebLogic server started until the last polling interval. Average Duration—Average time taken by the servlet to respond to requests in the last polling interval. Path—Path of the servlet. Servlet Capacity—Maximum capacity of the servlet in single-thread mode in the last polling interval. More—Click More to view information about all the servlets in a separate window.
Adding a GlassFish server application monitor APM monitors GlassFish servers through JMX. When you add application monitors for GlassFish servers, follow these guidelines: Add the GlassFish server hosts to the IMC Platform so APM can obtain and display network connections of the hosts and their access devices in the application topology. For more information about adding hosts to the IMC Platform, see HP IMC Base Platform Administrator Guide.
and operating system applications by IP address and displays their dependencies in the application topology. 5. Detect Application—Select this parameter if you want to enable application detection. Application detection enables APM to verify connection to the application by using the previous parameter settings, and to determine whether to add the application monitor based on the verification result. APM adds the application monitor only when it can connect to the application.
application topology. To remove dependencies between the GlassFish server and one or more applications, select the target applications in the Related Applications box and click Delete. 5. Detect Application—Select this parameter if you want to enable application detection. Application detection enables APM to verify connection to the application by using the previous parameter settings, and to determine whether to modify the application monitor based on the verification result.
Figure 246 Monitor Information area layout Monitor Information area fields: Name—Application monitor name. Health State—Health state of the GlassFish server application. IP Address—IP address of the GlassFish server host. Application Type—Type of the monitored application, which is always GlassFish Server. Last Polling Time—Time when APM last polled the GlassFish server application.
Availability pie chart—Shows time duration percentages of the availability states for the GlassFish server today. The availability states include Available, Unavailable, Inaccessible, and Unmanaged. To view the time duration percentage of a specific availability state, hover the cursor over the corresponding slice in the chart. Current Availability—Availability of the GlassFish server in the last polling period.
dotted lines. The data is highlighted in yellow when the response time reaches the level-1 threshold, and is highlighted in red when the response time reaches the level-2 threshold. Use the global thresholds or self-defined thresholds. For information about setting the thresholds, see "Threshold Management." History icon —Click the History icon to view the history graph of the response time trend of the GlassFish server.
lines. The data is highlighted in yellow when it reaches the level-1 threshold, and is highlighted in red when it reaches the level-2 threshold. Use the global thresholds or self-defined thresholds. For information about setting the thresholds, see "Threshold Management." History icon —Click the History icon to view the history graph of the memory usage trend of the GlassFish server. Hover the cursor over a spot on the curve to view the data at the specific time point.
Figure 251 Web Application area layout Web Application area fields: Web Application Name—Name of the Web application. Web Application Directory—Directory that locates the project file of the Web application on the GlassFish server. Application Traffic The Application Traffic area layout is shown in Figure 252. APM collects the traffic statistics of the GlassFish server based on the IP address and port number of the GlassFish server host.
Adding a WebSphere server application monitor APM monitors the WebSphere servers through the SOAP service provided by the server. When you add application monitors for WebSphere servers, follow these guidelines: Add WebSphere hosts to the IMC Platform so APM can obtain and display network connections of the hosts and their access devices in the application topology. For more information about adding hosts to the IMC Platform, see HP IMC Base Platform Administrator Guide.
server and operating system applications by IP address and displays their dependencies in the application topology. 5. Detect Application—Select this parameter if you want to enable application detection. Application detection enables APM to verify connection to the application by using the previous parameter settings, and to determine whether to add the application monitor based on the verification result. APM adds the application monitor only when it can connect to the application.
application topology. To remove dependencies between the WebSphere server and one or more applications, select the target applications in the Related Applications box and click Delete. 5. Detect Application—Select this parameter if you want to enable application detection. Application detection enables APM to verify connection to the application by using the previous parameter settings, and to determine whether to modify the application monitor based on the verification result.
Figure 254 Monitor Information area layout Monitor Information area fields: Name—Application monitor name. Health State—Health state of the WebSphere server application. IP Address—IP address of the WebSphere server host. Application Type—Type of the monitored application, which is always WebSphere. Version—Version of the WebSphere server. Last Polling Time—Time when APM last polled the WebSphere server application.
Figure 255 Availability Today area layout Availability Today area fields: Availability pie chart—Shows time duration percentages of the availability states for the WebSphere server today. The availability states include Available, Unavailable, Inaccessible, and Unmanaged. To view the time duration percentage of a specific availability state, hover the cursor over the corresponding slice in the chart. Current Availability—Availability of the WebSphere server in the last polling period.
Figure 256 Response Time area layout Response Time area fields: Response time trend graph—Shows changes of the response time of the WebSphere server over the selected time period in a line graph. Hover the cursor over a spot in the curve to view the response time at the specific time point. By default, the graph shows the last 1 hour data. To change the report period, click the Last 1 Hour icon on the upper right of the graph, and then select an icon from the list.
Figure 257 Thread Pool area layout Thread Pool area fields: Thread count trend graph—Shows changes of the active thread count and average thread count of the WebSphere server over the last 1 hour. The green curve shows the active thread count and the orange curve shows the average thread count. Hover the cursor over a spot on the curve to view the thread count and daemon thread count at the specific time point.
Figure 258 Memory area layout Memory area fields: Memory usage trend graph—Shows changes of the sizes of the free memory, used memory, and total memory of the WebSphere server over the selected time period in a line graph. Hover the cursor over a spot in the curve to view the memory usage data at the specific time point. By default, the graph shows the last 1 hour data. To change the report period, click the Last 1 Hour icon on the upper right of the graph, and then select an icon from the list.
Figure 259 Web Application area layout Web Application area fields: Requests processed by servlet trend graph—Shows changes of the number of requests processed by the Servlet over the selected time period in a line graph. Hover the cursor over a spot in the curve to view the number of processed requests at the specific time point. By default, the graph shows the last 1 hour data.
Figure 260 Transactions area layout Transactions area fields: Transactions trend graph—Shows changes of the numbers of global transactions, local transactions, and active global transactions of the WebSphere server over the last 1 hour in a line graph. Hover the cursor over a spot in the curve to view the transaction statistics at the specific time point. To change the report period, click the Last 1 Hour icon on the upper right of the graph, and then select an icon from the list.
JDBC Connection Pool The JDBC Connection Pool area layout is shown in Figure 261. Figure 261 JDBC Connection Pool area layout JDBC Connection Pool area fields: Trend graph—Shows changes of the numbers of created connections, closed connections, and allocated connections in the JDBC connection pool over the last 1 hour in a line graph. Hover the cursor over a spot in the curve to view the transaction statistics at the specific time point.
Figure 262 Application Traffic area layout Application Traffic area fields: Application Traffic trend graph—Shows changes of inbound (Rx) and outbound (Tx) traffic over the last 1 hour. The green curve shows the inbound traffic and the orange curve shows the outbound traffic. To change the report period, click the Last 1 Hour icon on the upper right of the graph, and then select an icon from the list. Available options include Last 6 Hours , Today , Yesterday , This Week , This Month , and This Year .
12 Web server monitor Web server monitor can monitor the following server types: Apache server IIS server PHP This chapter describes how to add/modify these types of application monitor and the details of application monitor reports. Apache server As a stable, powerful, open-source Web server, Apache is widely used in the Internet. APM can monitor Apache 2.x.
Add Apache server hosts to the IMC platform so APM can obtain and display network connections of the hosts and their access devices in the application topology. For more information about adding hosts to the IMC platform, see HP IMC Base Platform Administrator Guide. To view traffic statistics in the monitor report of the Apache server application, make sure at least one probe is configured in APM.
5. Click OK. Modifying an Apache server application monitor When you modify an Apache server application monitor, you can modify all parameters except the IP address of the Apache server application monitor. If the IP address of the Apache server changes, you must add a new application monitor for the host. However, the new application monitor cannot inherit the history data from the previous application monitor. To modify an Apache server application monitor: 1. Click the Resource tab. 2.
To access the Apache server application monitor report: 1. Click the Resource tab. 2. Select Application Manager > Application Monitor from the navigation tree. The application monitor list page displays all application monitors. 3. Click the name link of an Apache server application monitor whose report you want to view. The Apache server application monitor report appears, as shown in Figure 263. For information about the icons in the monitor report, see "2 Quick start.
Application Type—Type of the monitored application, which is always Apache Server. Port—Enter the port through which the Apache server provides Web services. Version–Version of Apache. Server Uptime—Uptime of the Apache server when APM last polled the Apache server. Total Bytes—Number of bytes of the page requests received by the Apache server when APM last polled the Apache server.
To view the availability of the Apache server in the last 30 days, click the Monthly History icon . The monthly availability data is collected in days. To view the time duration percentages of availability states on a specific day, place the cursor over that day. Available Time—Total available time duration of the Apache server since 00:00 today. Unavailable Time—Total unavailable time duration of the Apache server since 00:00 today.
Figure 267 Application Traffic area layout Application Traffic area fields: Application Traffic trend graph—Shows changes of inbound and outbound traffic over the last 1 hour. The green curve shows the inbound traffic and the orange the outbound traffic. To change the report period, click the Last 1 Hour icon on the upper right of the graph, and then select an icon from the list. Available options include Last 6 Hours , Today , Yesterday , This Week , This Month , and This Year .
To view traffic statistics in the monitor report of the IIS server application, make sure at least one probe is configured in APM. After an IIS server monitor is added, APM sends the IP address of the monitored IIS server to the probes for traffic collection. To add an IIS server application monitor: 1. Click the Resource tab. 2. Enter the Add Application page in one of the following ways: Select Application Manager > Add Application from the navigation tree.
verification result. APM adds the application monitor only when it can connect to the application. When this parameter is not selected, APM adds the application monitor without verifying the connection. 5. Click OK. Modifying an IIS server application monitor When you modify an IIS server application monitor, you can modify all parameters except the IP address of the IIS server application monitor. If the IP address of the IIS server changes, you must add a new application monitor for the host.
application. When this parameter is not selected, APM modifies the application monitor without verifying the connection. 5. Click OK. Viewing the IIS server application monitor report After you add an IIS server application monitor, APM starts collecting index data of the application to calculate its availability and health status. Through the IIS server application monitor report, operators can obtain monitor indexes of the application. To access the IIS server application monitor report: 1.
Name—Application monitor name. Health State—Health state of the IIS server. IP Address—IP address of the IIS server. Application Type—Type of the monitored application, which is always IIS Server. Service Uptime—Uptime of the IIS server when APM last polled the IIS server. Last Polling Time—Time when APM last polled the IIS server.
Unavailable Time—Total unavailable time duration of the IIS server since 00:00 today. Inaccessible Time—Total inaccessible time duration of the IIS server since 00:00 today. Unmanaged Time—Total unmanaged time duration of the IIS server since 00:00 today. The availability time statistics of a new application monitor are collected since the application monitor was added. An availability time field does not appear if its value is 0. Connections The Connections area layout is shown in Figure 271.
Figure 272 HTTP area layout HTTP area fields: HTTP trend graph—Shows changes of the HTTP response time over the last 1 hour in a graph. Hover the cursor over a spot on the curve to view the HTTP response time at the specific time point. To change the report period, click the Last 1 Hour icon on the upper right of the graph, and then select an icon from the list. Available options include Last 6 Hours , Today , Yesterday , This Week , This Month , and This Year .
Figure 273 Access Information area layout Access Information area fields: Access Information trend graph—Shows changes of the send/receive rates over the last 1 hour in a graph. Hover the cursor over a spot on the curve to view the send/receive rates at the specific time point. To change the report period, click the Last 1 Hour icon on the upper right of the graph, and then select an icon from the list. Available options include Last 6 Hours , Today , Yesterday , This Week , This Month , and This Year .
Figure 274 File Information area layout File Information area fields: File Information trend graph—Shows changes of the file send/receive rates over the last 1 hour in a graph. Hover the cursor over a spot on the curve to view the send/receive rates at the specific time point. To change the report period, click the Last 1 Hour icon on the upper right of the graph, and then select an icon from the list. Available options include Last 6 Hours , Today , Yesterday , This Week , This Month , and This Year .
Figure 275 Anonymous Access area layout Anonymous Access area fields: Anonymous Access trend graph—Shows changes of the anonymous accesses over the last 1 hour in a graph. Hover the cursor over a spot on the curve to view the IMAP connection number at the specific time point. To change the report period, click the Last 1 Hour icon on the upper right of the graph, and then select an icon from the list. Available options include Last 6 Hours , Today , Yesterday , This Week , This Month , and This Year .
Figure 276 Non-Anonymous Access area layout Non-Anonymous Access area fields: Non-Anonymous Access trend graph—Shows changes of the non-anonymous accesses over the last 1 hour in a graph. Hover the cursor over a spot on the curve to view the non-anonymous accesses at the specific time point. To change the report period, click the Last 1 Hour icon on the upper right of the graph, and then select an icon from the list.
Application Traffic trend graph—Shows changes of inbound and outbound traffic over the last 1 hour. The green curve shows the inbound traffic and the orange the outbound traffic. To change the report period, click the Last 1 Hour icon on the upper right of the graph, and then select an icon from the list. Available options include Last 6 Hours , Today , Yesterday , This Week , This Month , and This Year .
Name—Enter a unique application monitor name. HP recommends that you use the Application name_host IP address format to name the application monitor. Description—Enter a description for the application monitor to aid maintenance. Port—Enter the Web service port number, which is 80 by default. 5. IP Address—Enter the IP address of the host on which the PHP server to be monitored is installed.
Description—Enter a description for the application monitor to aid maintenance. Port—Enter the Web service port number, which is 80 by default. 4. Name—Modify the unique application monitor name. HP recommends using Application name_host IP address format for naming the application monitor. Traffic Collection Port—Modify the service port number for the PHP server. This field appears only when at least one probe is configured for APM.
Figure 278 Part of a PHP application monitor report Monitor Information The Monitor Information area layout is shown in Figure 279. Figure 279 Monitor Information area layout Monitor Information area fields: Name—Application monitor name. Health State—Health state of PHP. IP Address—IP address of the Web server which can parse PHP. Application Type—Type of the monitored application, which is always PHP. Port—Enter the port through which the Apache server provides Web services.
Figure 280 Availability Today area layout Availability Today area fields: Availability pie chart—Shows time duration percentages of the availability states for PHP today. The availability states include Available, Unavailable, Inaccessible, and Unmanaged. To view the time duration percentage of a specific availability state, place the cursor over the corresponding slice in the chart. Current Availability—Availability of PHP when APM last polled PHP.
Figure 281 Response Time area layout Response Time area fields: Response Time trend graph—Shows changes of the PHP response time over the last 1 hour in a graph. Hover the cursor over a spot on the curve to view the PHP response time at the specific time point. To change the report period, click the Last 1 Hour icon on the upper right of the graph, and then select an icon from the list. Available options include Last 6 Hours , Today , Yesterday , This Week , This Month , and This Year .
report period, click the Last 1 Hour icon on the upper right of the graph, and then select an icon from the list. Available options include Last 6 Hours , Today , Yesterday , This Week , This Month , and This Year . Hover the cursor over a spot on the curve to view the application traffic at the specific time point. Click Rx or Tx to display or hide the corresponding monitor index in the graph. Attribute/Value—Monitor index name and data that was obtained when APM last polled the PHP server.
13 Mail server monitor APM supports monitoring the following mail servers: Exchange Server 2003 Exchange Server 2007 POP3 SMTP This chapter describes how to add and modify mail server application monitors and how to view relevant monitor reports. Exchange Server 2003 The Microsoft Exchange Server 2003 provides mail services for domain users by cooperating with Active Directory. It supports SMTP, POP3, and IMAP4 mail protocols.
IP Address—Enter the IP address of the host on which the Exchange Server 2003 application to be monitored is installed. If the host is already added to the IMC Platform, you can also click Select and select the host in the Select Devices window. For information about selecting a host, see "2 Quick start." APM automatically checks the specified IP address and associates the application monitor with the host managed in the IMC Platform. Name—Enter a unique application monitor name.
5. Click OK. Modifying an Exchange Server 2003 application monitor Authorized users can modify all parameters of an Exchange Server 2003 application monitor except the IP address. If the IP address of a monitored Exchange Server 2003 host changes, add a new application monitor for the host. The new application monitor cannot inherit the history data from the previous application monitor. To modify an Exchange Server 2003 application monitor: 1. Click the Resource tab. 2.
5. Simple Mail Transfer Protocol (SMTP) Related Applications—Modify the applications that Exchange Server 2003 depends on. Click Add, and then select applications in the popup Select Applications window. Operating system applications, such as Windows, AIX, FreeBSD, OpenBSD, HP-UX, Solaris, Mac OS, and Linux, cannot be selected.
Figure 284 Monitor Information area layout Monitor Information area fields: Name—Application monitor name. Health State—Health status of the Exchange Server 2003 application. IP Address—IP address of the Exchange Server 2003 host. Application Type—Type of the monitored application, which is always Exchange 2003. Last Polling Time—Time when APM last polled the Exchange Server 2003 application.
Availability Today area fields: Availability pie chart—Shows time duration percentages of the availability states for Exchange Server 2003 today. The availability states include Available, Unavailable, Inaccessible, and Unmanaged. To view the time duration percentage of a specific availability state, hover the cursor over the corresponding slice in the chart. Current Availability—Availability of Exchange Server 2003 in the last polling period.
POP The POP area layout is shown in Figure 287. Figure 287 POP area layout POP area fields: POP connection trend graph—Shows changes of the POP connections used by Exchange Server 2003 over the last 1 hour in a line chart. Hover the cursor over a spot on the curve to view the POP connection number at the specific time point. To change the report period, click the Last 1 Hour icon on the upper right of the graph, and then select an icon from the list.
Figure 288 Mailbox area layout Mailbox area fields: Attribute/Value—Monitor index name and data that was obtained when APM last polled Exchange Server 2003. Size—Disk space occupied by all mailboxes. Rx Queue Length—Number of mail messages in the mailbox receive queue. Tx Queue Length—Number of mail messages in the mailbox transmit queue. Active Clients—Number of clients that operated a mailbox in the last 10 minutes. Total Logins—Number of clients logging in to the mailboxes.
Figure 289 Public Folder area layout Public Folder area fields: Attribute/Value—Monitor index name and data that was obtained when APM last polled Exchange Server 2003. Size—Disk space occupied by all public folders. Tx Queue Length—Number of mail messages in the public folder storage transmit queue. Rx Queue Length—Number of mail messages in the public folder storage receive queue. Active Clients—Number of clients that operated a public folder in the last 10 minutes.
Figure 290 Statistics area layout Statistics area fields: Attribute/Value—Monitor index name and data that was obtained when APM last polled Exchange Server 2003. Active Connections—Number of connections to a mailbox or public folder in the last 10 minutes. Connections—Number of client connections to the Exchange information store. Active Users—Number of users that have performed operations in the last 10 minutes. SRS The SRS area displays replications between Exchange Server 2003 servers.
ES The ES area displays the number of notifications to be processed when APM last polled Exchange Server 2003, as shown in Figure 293. Figure 293 ES area layout MTA Statistics The MTA Statistics area monitors operation of the Message Transport Agent (MTA) of Exchange Server 2003. The MTA Statistics area layout is shown in Figure 294. Figure 294 MTA Statistics area layout MTA Statistics area fields: Attribute/Value—Monitor index name and data that was obtained when APM last polled Exchange Server 2003.
Figure 295 TD Statistics area layout TD Statistics area fields: Attribute/Value—Monitor index name and data that was obtained when APM last polled Exchange Server 2003. Message to Send—Number of mail messages delivered to the message database (MDB). MDB is a database instance of Exchange Server 2003. MDB can be identified as mailbox or public folder storage based on the stored data type. Message from MTA to IS—Number of mail messages delivered from MTA to information storage (IS).
Last Hour's Traffic—Total traffic sent and received by Exchange Server 2003 over the last 1 hour. Today's Traffic—Total traffic sent and received by Exchange Server 2003 since 00:00 today.
Local Retry Queue Length—Retry queue length of mail messages locally delivered by Exchange Server 2003 in the last polling period. Local Queue Length—Queue length of mail messages locally delivered by Exchange Server 2003 in the last polling period. Remote Retry Queue Length—Retry queue length of mail messages delivered to the external mail system of Exchange Server 2003 in the last polling period.
The page displays all application types that can be monitored by APM. 3. Select Application Manager > Application Monitor from the navigation tree, and click Add on the application monitor list page. Click Exchange 2007 of the Mail Server Monitor class. The page for adding an Exchange Server 2007 application monitor appears. 4.
5. Microsoft Exchange Service Host Microsoft Exchange Transport Microsoft Exchange Transport Log Search Microsoft Exchange Unified Messaging Microsoft Search (Exchange) Microsoft Exchange ADAM Microsoft Exchange Edge Credential Service Related Applications—Configure the applications that Exchange Server 2007 depends on. Click Add, and then select applications in the popup Select Applications window.
Username—Modify the username of the administrator who is authorized to manage the host. If the administrator is a domain user, use domain name\username. If the administrator is a local user, use host name\username or IP address\username, or use username. Password—Enter the password of the administrator. Contact—Modify the user contact information, such as name, email address, and telephone number.
application. When this parameter is not selected, APM modifies the application monitor without verifying the connection. 5. Click OK. Viewing the Exchange Server 2007 application monitor report After adding an Exchange Server 2007 application monitor, APM collects index data of the application to calculate its availability and health status. Obtain monitor indexes of the Exchange Server 2007 by viewing the monitor report. To access the Exchange Server 2007 application monitor report: 1.
Health State—Health status of the Exchange Server 2007 application. IP Address—IP address of the Exchange Server 2007 host. Application Type—Type of the monitored application, which is always Exchange 2007. Last Polling Time—Time when APM last polled the Exchange Server 2007 application. Relationship icon —Click the Relationship icon to view dependencies between the Exchange Server 2007 application and other applications in a dependency topology view.
Unmanaged Time—Total unmanaged time duration of Exchange Server 2007 since 00:00 today. Availability time statistics of a new application monitor are collected after the application monitor was added. An availability time field does not appear if its value is 0. IMAP4 The IMAP4 area layout is shown in Figure 302. Figure 302 IMAP4 area layout IMAP4 area fields: IMAP4 connection trend graph—Shows changes of the IMAP4 connections used by Exchange Server 2007 over the last 1 hour in a line chart.
Figure 303 POP3 area layout POP3 area fields: POP3 connection trend graph—Shows changes of the POP3 connections used by Exchange Server 2007 over the last 1 hour in a line chart. Hover the cursor over a spot on the curve to view the POP3 connection number at the specific time point. To change the report period, click the Last 1 Hour icon on the upper right of the graph, and then select an icon from the list.
Figure 304 SMTP Send area layout SMTP Send area fields: SMTP Send connection trend graph—Shows changes of the outbound SMTP connections used by Exchange Server 2007 over the last 1 hour in a line chart. Hover the cursor over a spot on the curve to view the outbound SMTP connection number at the specific time point. To change the report period, click the Last 1 Hour icon on the upper right of the graph, and then select an icon from the list.
Figure 305 SMTP Receive area layout SMTP Receive area fields: SMTP Receive connection trend graph—Shows changes of the inbound SMTP connections used by Exchange Server 2007 over the last 1 hour in a line chart. Hover the cursor over a spot on the curve to view the inbound SMTP connection number at the specific time point. To change the report period, click the Last 1 Hour icon on the upper right of the graph, and then select an icon from the list.
Figure 306 Buffer State area layout Buffer State area fields: Attribute/Value—Monitor index name and data that was obtained when APM last polled Exchange Server 2007. Uncompleted RPC Requests—Number of RPC requests that have not been processed. RPC Requests Sent/Sec—Number of RPC requests sent per second. Average Delay—Average delay of RPC requests. Active Connections—Number of active connections in all connection caches.
Message for Delivery/Sec—Number of items to be delivered per second. Messages for Delivery/Sec—Number of mail messages added to the mailbox transmit queue and to be delivered per second. Mailbox Redelivery Queue Length—Number of mail messages in the redelivery queue. Remote Redelivery Queue Length—Number of mail messages to be delivered in the remote redelivery queue. Messages Submitted/Sec—Number of mail messages added to the submit queue per second.
Application Traffic APM collects Exchange Server 2007 traffic based on the IP address of the host and the traffic collection port used by the application. The Application Traffic area layout is shown in Figure 310. Figure 310 Application Traffic area layout Application Traffic area fields: Application Traffic trend graph—Shows changes of inbound and outbound traffic over the last 1 hour. The green curve shows the inbound traffic and the orange curve shows the outbound traffic.
Service The Service area monitors the following Exchange Server 2007 services: Microsoft Exchange Active Directory Topology Microsoft Exchange Anti-spam Update Microsoft Exchange EdgeSync Microsoft Exchange File Distribution Microsoft Exchange IMAP4 Microsoft Exchange Information Store Microsoft Exchange Mailbox Assistants Microsoft Exchange Mail Submission Microsoft Exchange Monitoring Microsoft Exchange POP3 Microsoft Exchange Replication Microsoft Exchange S
Exchange MTA Stacks instead of the original name MSExchangeMTA. Typically, the display name identifies a service more clearly. Status—Service state of Exchange Server 2007 in the last polling period. More—Click More to view status of all services that are being monitored. POP3 The Post Office Protocol with version 3 (POP3) enables local email clients to retrieve mail messages from a remote mail server to their local hosts for management. Most mail servers support POP3.
5. Polling Interval (min)—Select a polling interval for the application monitor. Available options include 1, 2, 3, 4, 5, 10, 20, and 30. The default polling interval is 5 minutes. A shorter polling interval provides more accurate real-time data but consumes more system resources. Username/Password—Enter the mailbox username and password. Contact—Enter user contact information, such as name, email address, and telephone number.
selected. APM automatically adds the dependencies between POP3 and operating system applications by IP address and displays their dependencies in the application topology. To remove dependencies between POP3 and one or more applications, select the target applications in the Related Applications box and click Delete. 5. Detect Application—Select this parameter if you want to enable detection as needed.
Figure 314 Monitor Information area layout Monitor Information area fields: Name—Application monitor name. Health State—Health status of the POP3 application. IP Address—IP address of the POP3 host. Application Type—Type of the monitored application, which is always POP3. Port—POP3 service port. Last Polling Time—Time when APM last polled the POP3 application.
Figure 315 Availability Today area layout Availability Today area fields: Availability pie chart—Shows time duration percentages of the availability states for POP3 today. The availability states include Available, Unavailable, Inaccessible, and Unmanaged. To view the time duration percentage of a specific availability state, hover the cursor over the corresponding slice in the chart. Current Availability—Availability of the POP3 service in the last polling period.
Figure 316 Response Time area layout Response Time area fields: POP3 response time trend graph—Shows changes of the round trip response time for the POP3 service over the last 1 hour in a line chart. Hover the cursor over a spot on the curve to view the service response time at the specific time point. To change the report period, click the Last 1 Hour icon on the upper right of the graph, and then select an icon from the list.
Application Traffic trend graph—Shows changes of inbound and outbound POP traffic over the last 1 hour. The green curve shows the inbound traffic and the orange curve shows the outbound traffic. To change the report period, click the Last 1 Hour icon on the upper right of the graph, and then select an icon from the list. Available options include Last 6 Hours , Today , Yesterday , This Week , This Month , and This Year .
5. Name—Enter a unique application monitor name. HP recommends using Application name_host IP address for naming the application monitor. Description—Enter a description for the application monitor to aid maintenance. IP Address—Click Select and select the target host that provides the SMTP service in the Select Devices window. Port—Enter the SMTP service port. The default value is 25. Polling Interval (min)—Select a polling interval for the application monitor.
5. Port—Modify the SMTP service port. Polling Interval (min)—Modify the polling interval for the application monitor. Available options include 1, 2, 3, 4, 5, 10, 20, and 30, in minutes. A shorter polling interval provides more accurate real-time data but consumes more system resources. Username/Password—Modify the username and password for identity authentication of SMTP. Email Address—Enter a new valid email address that is located on the host that provides the SMTP service.
Figure 318 Part of an SMTP application monitor report Monitor Information The Monitor Information area layout is shown in Figure 319. Figure 319 Monitor Information area layout Monitor Information area fields: Name—Application monitor name. Health State—Health status of the SMTP application. IP Address—IP address of the SMTP host. Application Type—Type of the monitored application, which is always SMTP. Port—SMTP service port.
Figure 320 Availability Today area layout Availability Today area fields: Availability pie chart—Shows time duration percentages of the availability states for SMTP today. The availability states include Available, Unavailable, Inaccessible, and Unmanaged. To view the time duration percentage of a specific availability state, hover the cursor over the corresponding slice in the chart. Current Availability—Availability of the SMTP service in the last polling period.
Figure 321 Response Time area layout Response Time area fields: SMTP response time trend graph—Shows changes of the round trip response time for the SMTP service over the last 1 hour in a line chart. Hover the cursor over a spot on the curve to view the service response time at the specific time point. To change the report period, click the Last 1 Hour icon on the upper right of the graph, and then select an icon from the list.
Application Traffic trend graph—Shows changes of inbound and outbound SMTP traffic over the last 1 hour. The green curve shows the inbound traffic and the orange curve shows the outbound traffic. To change the report period, click the Last 1 Hour icon on the upper right of the graph, and then select an icon from the list. Available options include Last 6 Hours , Today , Yesterday , This Week , This Month , and This Year .
14 Web service monitor APM supports monitoring the following types of Web services: RESTful Web service SOAP-based Web service This chapter describes how to add and modify Web service monitors, and helps you view relevant monitor reports. RESTful Web service Representational State Transfer (REST) is a predominant Web service design model and typically applies to HTTP-based APIs. A Web API or service that complies with constraints of REST architecture is called "RESTful Web service.
APM automatically checks the specified IP address and associates the application monitor with the host managed in the IMC Platform. Description—Enter a description for the application monitor. Port—Enter the HTTP port used by the RESTful Web service. 5. Name—Enter a unique application monitor name. HP recommends using Application name_host IP address for naming the application monitor.
Name—Modify the unique application monitor name. HP recommends using Application name_host IP address for naming the application monitor. Description—Modify description for the application monitor. Port—Modify the HTTP port used by the RESTful Web service. 5. IP Address—Cannot be modified. Traffic Collection Port—Modify the port used by the RESTful Web service to provide services. This field appears only after at least one probe is configured for APM.
Figure 323 Part of a RESTful Web service application monitor report Monitor Information Figure 324 Monitor Information area layout Monitor Information area fields: Name—Application monitor name. Health State—Health status of the RESTful Web service. IP Address—IP address of the host on which the RESTful Web service is located. Application Type—Type of the monitored application, which is always REST Service. Last Polling Time—Time when APM last polled the RESTful Web service.
Top5 Unrecovered Alarm—Latest five unrecovered alarms on the RESTful Web service. The alarm level is identified by color: yellow for minor alarms, orange for major alarms, and red for critical alarms. This field does not appear if no alarm is generated by the RESTful Web service. Availability Today The Availability Today area layout is shown in Figure 325.
Figure 326 Response time area layout Response Time area fields: Response time trend graph—Shows changes of the response time of the RESTful Web service over the last 1 hour in a line chart. Hover the cursor over a spot in the curve to view the service response time at the specific time point. To change the report period, click the Last 1 Hour icon on the upper right of the graph, and then select an icon from the list.
select an icon from the list. Available options include Last 6 Hours , Today , Yesterday , This Week , This Month , and This Year . Hover the cursor over a spot on the curve to view the application traffic at the specific time point. Click Rx or Tx to display or hide the corresponding monitor index in the graph. Attribute/Value—Monitor index name and data that was obtained when APM last polled the Restful Web service.
"2 Quick start." APM automatically checks the specified IP address and associates the application monitor with the host managed in the IMC Platform. Description—Enter a description for the application monitor. Port—Enter the HTTP port used by the SOAP-based Web service. 5. Name—Enter a unique application monitor name. HP recommends using Application name_host IP address for naming the application monitor.
Name—Modify the unique application monitor name. HP recommends using Application name_host IP address for naming the application monitor. Description—Modify a description for the application monitor. Port—Modify the HTTP port used by SOAP-based Web service. 5. IP Address—Cannot be modified. Traffic Collection Port—Modify the port used by the RESTful Web service to provide services. This field appears only after at least one probe is configured for APM.
The monitor report of SOAP-based Web service appears, as shown in Figure 328. For information about the icons in the monitor report, see "2 Quick start." This section describes the fields in each area of the monitor report. Figure 328 Part of a SOAP-based Web service application monitor report Monitor Information Figure 329 Monitor Information area layout Monitor Information area fields: Name—Application monitor name. Health State—Health status of the SOAP-based Web service.
Figure 330 Availability Today area layout Availability Today area fields: Availability pie chart—Shows time duration percentages of the availability states for SOAP-based Web service today. The availability states include Available, Unavailable, Inaccessible, and Unmanaged. To view the time duration percentage of a specific availability state, place the cursor over the corresponding slice in the chart. Current Availability—Availability of the SOAP-based Web service in the last polling period.
Figure 331 Response time area layout Response Time area fields: Response time trend graph—Shows changes of the response time of the SOAP-based Web service in the last 1 hour in a line chart. Hover the cursor over a spot in the curve to view the service response time at the specific time point. To change the report period, click the Last 1 Hour icon on the upper right of the graph, and then select an icon from the list.
To change the report period, click the Last 1 Hour icon on the upper right of the graph, and then select an icon from the list. Available options include Last 6 Hours , Today , Yesterday , This Week , This Month , and This Year . Hover the cursor over a spot on the curve to view the application traffic at the specific time point. Click Rx or Tx to display or hide the corresponding monitor index in the graph.
15 LDAP service monitor APM supports monitoring the following LDAP services: Active Directory service LDAP service This chapter describes how to add and modify LDAP service application monitors, and how to view relevant monitor reports. Active Directory service Active Directory (AD) is a directory service developed based on Lightweight Directory Access Protocol (LDAP) to run on the Windows Server operating systems. Administrators can easily locate the objects stored in the AD.
Quick start." APM automatically checks the specified IP address and associates the application monitor with the host managed in the IMC Platform. Name—Enter a unique application monitor name. HP recommends using Application name_host IP address for naming the application monitor. Description—Enter a description for the application monitor. Traffic Collection Port—Enter the listening port number for AD service. This field appears only when at least one probe is configured for APM.
Name—Modify the application monitor name, ensuring that it is unique. HP recommends using Application name_host IP for naming the application monitor. Description—Modify the description for the application monitor. Traffic Collection Port—Modify the listening port number for the AD service. This field appears only when at least one probe is configured for APM. Polling Interval (min)—Select a polling interval for the application monitor.
Figure 333 Part of an AD service application monitor report Monitor Information The Monitor Information area layout is shown in Figure 334. Figure 334 Monitor Information area layout Monitor Information area fields: Name—Application monitor name. Health State—Health status of the AD service. IP Address—IP address of the AD service host. Application Type—Type of the monitored application, which is always Active Directory. Last Polling Time—Time when APM last polled the AD service.
Figure 335 Availability Today area layout Availability Today area fields: Availability pie chart—Shows time duration percentages of the availability states for the AD service today. The availability states include Available, Unavailable, Inaccessible, and Unmanaged. To view the time duration percentage of a specific availability state, move the pointer over the corresponding slice in the chart. Current Availability—Availability of the AD service in the last polling period.
Figure 336 Network Monitor area layout Network Monitor area fields: ABClient session trend graph—Shows changes of the ABClient sessions used by AD service over the last 1 hour in a line chart. Hover the cursor over a spot on the curve to view the ABClient session number at the specific time point. To change the report period, click the Last 1 Hour icon on the upper right of the graph, and then select an icon from the list.
Figure 337 Database area layout Database area fields: Database file size trend graph—Shows changes of the ntds.dit file size over the last 1 hour in a line chart. Hover the cursor over a spot on the curve to view the ntds.dit file size at the specific time point. To change the report period, click the Last 1 Hour icon on the upper right of the graph, and then select an icon from the list. Available options include Last 6 Hours , Today , Yesterday , This Week , This Month , and This Year .
Figure 338 NTFRS Process area layout NTFRS Process area fields: CPU usage ratio trend graph—Shows changes of the CPU usage ratio used by the NTFRS process over the last 1 hour in a line chart. Hover the cursor over a spot on the curve to view the CPU usage ratio at the specific time point. To change the report period, click the Last 1 Hour icon on the upper right of the graph, and then select an icon from the list.
LSASS Process The Local Security Authority Subsystem Service (LSASS) process of the Windows operating system processes authentication requests and permits/denies user requests. It processes domain logins from users in AD. The LSASS Process area layout is shown in Figure 339. Figure 339 LSASS Process area layout LSASS Process area fields: CPU usage ratio trend graph—Shows changes of the CPU usage ratio used by the LSASS process over the last 1 hour in a line chart.
today, yesterday, this week, this month, and this year by clicking the corresponding icons on the upper right of the graph. Performance The Performance area layout is shown in Figure 340. Figure 340 Performance area layout Performance area fields: Performance trend graph—Shows changes of directory reads/writes per second over the last 1 hour in a line chart. Hover the cursor over a spot on the curve to view the directory reads/writes per second at the specific time point.
Figure 341 Copy Statistics area layout Copy Statistics area fields: Inbound/Outbound object trend graph—Shows changes of the number of inbound/outbound objects per second over the last 1 hour in a line chart. Hover the cursor over a spot on the curve to view the number of inbound/outbound objects per second at the specific time point. To change the report period, click the Last 1 Hour icon on the upper right of the graph, and then select an icon from the list.
LDAP Statistics The LDAP Statistics are shown in Figure 342. Figure 342 LDAP Statistics area layout LDAP Statistics area fields: LDAP statistics trend graph—Shows changes of the number of active LDAP threads/LDAP client sessions over the last 1 hour in a line chart. Hover the cursor over a spot on the curve to view the number of active LDAP threads/LDAP client sessions at the specific time point.
yesterday, this week, this month, and this year by clicking the corresponding icons on the upper right of the graph. Active Directory Service APM can obtain the service status on the server where AD the service is located through WMI parameters.
LDAP service This section describes how to add and modify the application monitor for the LDAP service and helps you view the monitor report. Adding an LDAP service application monitor APM monitors the running state of the LDAP service through the LDAP service port (TCP port 389 by default).
criteria. The AND or OR relationship setting varies with LDAP products. For more information, see the relevant product manual. 5. Search Base—Enter the basic directory for query. For example, if you enter ou=apm, dc=imc, dc=com, APM queries only entries of OU apm in the domain imc.com. Contact—Enter user contact information, such as name, email address, and telephone number. The default is the username of the operator who created the application monitor.
5. Password—Modify the password of the LDAP user. Query Filter—Modify the criteria for filtering queried entries. For example, if you enter cn=*, entries with any name are displayed. You can set the AND or OR relationship between multiple criteria. The AND or OR relationship setting varies with LDAP products. For more information, see the relevant product manual. Search Base—Modify the basic directory for query.
Figure 344 Part of an LDAP service application monitor report Monitor Information The Monitor Information area layout is shown in Figure 345. Figure 345 Monitor Information area layout Monitor Information area fields: Name—Application monitor name. Health State—Health status of the LDAP service. IP Address—IP address of the LDAP service host. Application Type—This is always LDAP. Port—Listening port number of the LDAP service. The default is 389.
Figure 346 Availability Today area layout Availability Today area fields: Availability pie chart—Shows time duration percentages of the availability states for the LDAP service today. The availability states include Available, Unavailable, Inaccessible, and Unmanaged. To view the time duration percentage of a specific availability state, move the pointer over the corresponding slice on the chart. Current Availability—Availability of the LDAP service in the last polling period.
Figure 347 Login Details area layout Login Details area fields: Login time trend graph—Shows changes of the login time of the LDAP service over the last 1 hour in a line chart. Hover the cursor over a spot on the curve to view the login time of the LDAP service at the specific time point. To change the report period, click the Last 1 Hour icon on the upper right of the graph, and then select an icon from the list.
Attribute/Value—Monitor index name and data. Search Time—Time taken for APM to query all entries passing the query filter in the Search Base and obtain the query result in the last APM polling period. Response Time—Time taken for APM to access the LDAP service and complete a query in the last APM polling period. The response time approximately equals login time plus search time. Set Threshold icon —Click the Set Threshold icon to set alarm thresholds for the response time.
16 File/Directory monitor APM supports monitoring the following: File Directory This chapter describes how to add and modify file/directory monitors, and helps you view relevant monitor reports. File APM can monitor the size and last modification time of individual files on Windows, UNIX, and Linux operating systems. This section describes how to add a file monitor, and helps you view the monitor report. Adding a file monitor APM monitors files through WMI or CLI.
checks the specified IP address and associates the application monitor with the host managed in the IMC Platform. Name—Enter a unique application monitor name. HP recommends using Application name_host IP address for naming the application monitor. Description—Enter a description for the application monitor. Polling Interval (min)—Select a polling interval for the application monitor. Available options include 1, 2, 3, 4, 5, 10, 20, and 30. The default polling interval is 5 minutes.
Password, Password + Super/Manager Password (No Operator), Username + Password + Super/Manager Password, No Username + No Password, and Username + No Password. The following parameters to be configured vary with authentication modes. Username—Enter the Telnet username. The user must have the operating system administrator's privilege. Password—Enter the password of the Telnet user. Super Password—Enter the super password with which a Telnet user can elevate privileges after login.
3. Click the Modify icon for the file monitor you want to modify. The page for modifying the file monitor appears. 4. Modify the following parameters for the application monitor: IP Address—Cannot be modified. Name—Modify the unique application monitor name. HP recommends using Application name_host IP address for naming the application monitor. Description—Modify the description for the application monitor. Polling Interval (min)—Select a polling interval for the application monitor.
Authentication Mode—Select the authentication mode for Telnet users. Options include Password (No Operator or Super/Manager), Username + Password, Super/Manager Password, Password + Super/Manager Password (No Operator), Username + Password + Super/Manager Password, No Username + No Password, and Username + No Password. The following parameters to be configured vary with authentication modes. Username—Enter the Telnet username. The user must have the operating system administrator's privilege.
The application monitor list page displays all application monitors. 3. Click the name link of a file monitor. The monitor report of the file appears, as shown in Figure 350. For information about the icons in the monitor report, see "2 Quick start." This section describes the fields in each area of the monitor report. Figure 350 Part of a file monitor report Monitor Information The Monitor Information area layout is shown in Figure 351.
IP Address—IP address of the host where the file is located. Application Type—Type of the monitored application, which is always File. Last Polling Time—Time when APM last polled the file. Relationship icon —Click the Relationship icon to view relations between applications in a dependency topology view. For more information about dependency topologies, see "Topology management." Top5 Unrecovered Alarm—Latest five unrecovered alarms on the file.
The availability time statistics of a new application monitor are collected since the application monitor was added. An availability time field does not appear if its value is 0. File Statistics The File Statistics area layout is shown in Figure 353. Figure 353 File Statistics area layout File Statistics area fields: File size trend graph—Shows changes of the file size over the last 1 hour in a line chart.
more information about adding hosts to the IMC Platform, see HP IMC Base Platform Administrator Guide. To monitor a directory on a Windows host, first configure and enable WMI for the Windows operating system (see the Microsoft Windows operating system online help), and provide the username and password of the user who has the Windows administrator's privileges.
Password—Enter the password of the SSH user. Private Key File—Enter the directory of the SSH private key file or browse to the file. Private Key Password—Enter the password to decrypt the SSH private key file. Super Password—Enter the super password with which an SSH user can elevate privileges after login. Port—Enter the SSH port on the operating system. Timeout (1-120 seconds)—Enter the maximum time period that APM waits for an SSH response from the operating system.
applications, such as Windows, AIX, FreeBSD, OpenBSD, HP-UX, Solaris, Mac OS, and Linux, cannot be selected. APM automatically adds the dependencies between the directory and operating system applications by IP address and displays their dependencies in the application topology. 5. Detect Application—Select this parameter if you want to enable application detection.
Super Password, and Password + Private Key + Super Password. The following parameters to be configured vary with authentication modes. Username—Enter the SSH username. The user must have the operating system administrator's privilege. Password—Enter the password of the SSH user. Private Key File—Enter the directory of the SSH private key file or browse to the file. Private Key Password—Enter the password to decrypt the SSH private key file.
5. Contact—Modify the contact information, such as name, email address, and telephone number. The default is the username of the operator who created the application monitor. Related Applications—Configure the applications that the directory depends on. Click Add, and then select applications in the popup Select Applications window. Operating system applications, such as Windows, AIX, FreeBSD, OpenBSD, HP-UX, Solaris, Mac OS, and Linux, cannot be selected.
Figure 355 Monitor Information area layout Monitor Information area fields: Name—Application monitor name. Health State—Health status of the directory. IP Address—IP address of the host where the directory is located. Application Type—Type of the monitored application, which is always Directory. Last Polling Time—Time when APM last polled the directory. Relationship icon —Click the Relationship icon to view relations between applications in a dependency topology view.
Figure 356 Availability Today area layout Availability Today area fields: Availability pie chart—Shows time duration percentages of the availability states for the directory today. The availability states include Available, Unavailable, Inaccessible, and Unmanaged. To view the time duration percentage of a specific availability state, place the cursor over the corresponding slice in the chart. Current Availability—Availability of the directory in the last polling period.
Figure 357 Directory Statistics area layout Directory Statistics area fields: Directory size trend graph—Shows changes of the directory size over the last 1 hour in a line chart. Place the cursor over a spot in the curve to view the directory size at the specific time point. By default, the graph shows the last hour data. To change the report period, click the Last 1 Hour icon on the upper right of the graph, and then select an icon from the list.
17 Service monitor APM supports monitoring the following services: SNMP service DNS service JavaRuntime FTP service SFTP service This chapter describes how to add and modify the application monitors, and helps you view relevant monitor reports. SNMP service Simple Network Management Protocol (SNMP) is a network management protocol widely supported by operating systems and network devices.
5. IP Address—Enter the IP address of the host on which the SNMP service application to be monitored is installed. If the host is already added to the IMC Platform, you can also click Select and select the host in the Select Devices window. For information about selecting a host, see "2 Quick start." APM automatically checks the specified IP address and associates the application monitor with the host managed in the IMC Platform. Name—Enter a unique application monitor name.
5. Description—Modify a description for the application monitor. OID—Modify the OID for SNMP monitoring. For example, the OID of the system up time (sysUpTime) is 1.3.6.1.2.1.1.3.0. Traffic Collection Port—Modify the SNMP service port. The default value is 161. This field appears only when at least one probe is configured for APM. Polling Interval (min)—Select a polling interval for the application monitor. Available options include 1, 2, 3, 4, 5, 10, 20, and 30 in minutes.
Figure 358 Part of an SNMP service application monitor report Monitor Information The Monitor Information area layout is shown in Figure 359. Figure 359 Monitor Information area layout Monitor Information area fields: Name—Application monitor name. Health State—Health status of the SNMP service application. IP Address—IP address of the SNMP service host. Application Type—Type of the monitored application, which is always SNMP Monitor.
Figure 360 Availability Today area layout Availability Today area fields: Availability pie chart—Shows time duration percentages of the availability states for the SNMP service today. The availability states include Available, Unavailable, Inaccessible, and Unmanaged. To view the time duration percentage of a specific availability state, place the cursor over the corresponding slice in the chart. Current Availability—Availability of the SNMP service in the last polling period.
Figure 361 Ping Test area layout Ping Test area fields: Ping Test response time trend graph—Shows changes of the round trip response time for the SNMP service over the selected time period in a line chart. Move the pointer over a spot on the curve to view the response time at the specific time point. To change the report period, click the Last 1 Hour icon on the upper right of the graph, and then select an icon from the list.
OID/Value—OID and its value for SNMP monitoring obtained in the last APM polling period. Application Traffic APM collects SNMP service traffic based on the IP address and port number of the SNMP host. The Application Traffic area layout is shown in Figure 40. Figure 363 Application Traffic area layout Application Traffic area fields: Application Traffic trend graph—Shows changes of inbound and outbound traffic over the last 1 hour.
To add a DNS service application monitor: 1. Click the Resource tab. 2. Enter the Add Application page in one of the following ways: Select Application Manager > Add Application from the navigation tree. The page displays all application types that can be monitored by APM. 3. Select Application Manager > Application Monitor from the navigation tree, and click Add on the application monitor list page. Click DNS Monitor of the Service Monitor class.
5. Contact—Enter the contact information, such as name, email address, and telephone number. The default is the username of the operator who created the application monitor. Related Applications—Configure the applications that DNS service depends on. Click Add, and then select applications in the popup Select Applications window. Operating system applications, such as Windows, AIX, FreeBSD, OpenBSD, HP-UX, Solaris, Mac OS, and Linux, cannot be selected.
topology. To remove dependencies between the DNS service and one or more applications, select the target applications in the Related Applications box and click Delete. 5. Detect Application—Select this parameter if you want to enable application detection. Application detection enables APM to verify connection to the application by using the previous parameter settings, and to determine whether to modify the application monitor based on the verification result.
Figure 365 Monitor Information area layout Monitor Information area fields: Name—Application monitor name. Health State—Health status of the DNS service application. IP Address—IP address of the DNS service host. Application Type—Type of the monitored application, which is always DNS Monitor. Last Polling Time—Time when APM last polled the DNS service.
Availability pie chart—Shows time duration percentages of the availability states for the DNS service today. The availability states include Available, Unavailable, Inaccessible, and Unmanaged. To view the time duration percentage of a specific availability state, place the cursor over the corresponding slice in the chart. Current Availability—Availability of the DNS service in the last polling period.
Refresh icon —Click the Refresh icon to refresh the content displayed in the area. Response time trend graph—Shows changes of the round trip response time for the DNS service over the selected time period in a line chart. Move the pointer over a spot in the curve to view the response time at the specific time point. Attribute/Value—Monitor index name and data. Response Time—Round trip response time of the DNS service in the last APM polling period.
Last Hour's Traffic—Total traffic sent and received by DNS service over the last 1 hour. Today's Traffic—Total traffic sent and received by DNS service since 00:00 today. JavaRuntime JavaRuntime refers to Java Runtime Environment (JRE). It is required to run Java applications and applets. APM monitors JRE applications. Java Management Extensions—JMX, is a Java technology that supplies tools for managing and monitoring applications, system objects, devices and service oriented networks.
Adding JavaRuntime application monitor When you add application monitors for JavaRuntime, follow these guidelines: The target hosts must be added to the IMC Platform so that the connections between the devices and access devices can be obtained. For information about adding devices to the IMC Platform, see HP IMC Base Platform Administrator Guide. If authentication is required for remote RMI access (the value for Dcom.sun.management.jmxremote.
5. Related Applications—Click Add. The Select Applications window appears. Select the applications that the JavaRuntime depends on, and click OK. Operating system applications, such as Windows, AIX, FreeBSD, OpenBSD, HP-UX, Solaris, Mac OS, and Linux, cannot be selected. View the dependencies between applications in a topology view. Detect Application—Select this parameter if you want to enable application detection.
select the target applications in the Related Applications box and click Delete. View the dependencies between applications in a topology view. 4. Detect Application—Select this parameter if you want to enable application detection. Application detection enables APM to verify connection to the application by using the previous parameter settings, and to determine whether to modify the application monitor based on the verification result.
Figure 370 Monitor Information area layout Monitor Information area fields: Name—Application monitor name. Health State—Health status of the JavaRuntime application. IP Address—IP address of the JavaRuntime host. Application Type—Type of the application, which is always JavaRuntime. VM Version—Version of the Java VM that the JavaRuntime uses. Last Polling Time—Time when APM last polled the JavaRuntime. Arch—Architecture of the JavaRuntime host.
Figure 371 Availability Today area layout Availability Today area fields: Availability pie chart—Shows time duration percentages of the availability states for the JavaRuntime today. The availability states include Available, Unavailable, Inaccessible, and Unmanaged. To view the time duration percentage of a specific availability state, place the cursor over the corresponding slice in the chart. Current Availability—Availability of the JavaRuntime in the last polling period.
Figure 372 OS area layout OS area fields: Attribute/Value—Monitor index name and data. Available processors—Number of processors on the JavaRuntime host. For a multi-core CPU, each core represents a processor. Committed Virtual Memory Size—Virtual memory size assigned to the JavaRuntime process when APM last polled JavaRuntime. Free Physical Memory Size—Free physical memory size on the JavaRuntime host when APM last polled JavaRuntime.
Figure 373 Runtime area layout Runtime area fields: Attribute/Value—Monitor index name and data. Name—Name of the JavaRuntime. Spec Name—Name of the JavaRuntime specification. Spec Vendor—Vendor of the JavaRuntime specification. Spec Version—Version of the JavaRuntime specification. VM Name—Name of the Java VM. VM Vendor—Vendor of the Java VM. VM Version—Version of the Java VM. Heap Memory Usage The Heap Memory Usage area layout is shown in Figure 374.
Set Threshold icon —Click the Set Threshold icon to set alarm thresholds for the used memory. The specified alarm thresholds appear on the Ping Test trend graph as dotted lines. The data is highlighted in orange when the used memory reaches the level-1 threshold, and is highlighted in red when the used memory reaches the level-2 threshold. Use the global thresholds or custom thresholds. For information about setting the thresholds, see "Threshold Management.
Application Traffic area fields: Application Traffic trend graph—Shows changes of inbound and outbound traffic over the last 1 hour. The green curve shows the inbound traffic and the orange curve shows the outbound traffic. To change the report period, click the Last 1 Hour icon on the upper right of the graph, and then select an icon from the list. Available options include Last 6 Hours , Today , Yesterday , This Week , This Month , and This Year .
To view traffic statistics in the monitor report of the FTP service application, make sure at least one probe is configured in APM. After an FTP application monitor is added, APM sends the IP address and port of the monitored FTP service application to the probes for traffic collection. To add an FTP service application monitor: 1. Click the Resource tab. 2. Enter the Add Application page in one of the following ways: Select Application Manager > Add Application from the navigation tree.
5. Related Applications—Configure the applications that the FTP server depends on. Click Add, and then select applications in the popup Select Applications window. Operating system applications, such as Windows, AIX, FreeBSD, OpenBSD, HP-UX, Solaris, Mac OS, and Linux, cannot be selected. APM automatically adds the dependencies between the FTP service and operating system applications by IP address and displays their dependencies in the application topology.
5. Port—Modify the port on FTP. Traffic Collection Port—Modify the service port number for FTP. This field appears only when at least one probe is configured for APM. Polling Interval (min)—Select a polling interval for the application monitor. Available options include 1, 2, 3, 4, 5, 10, 20, and 30 in minutes. A shorter polling interval provides more accurate real-time data but consumes more system resources.
Figure 378 Part of an FTP service application monitor report Monitor Information The Monitor Information area layout is shown in Figure 379. Figure 379 Monitor Information area layout Monitor Information area fields: Name—Application monitor name. Health State—Health status of the FTP service application. IP Address—IP address of the FTP service host. Application Type—Type of the monitored application, which is always FTP Monitor.
Figure 380 Availability Today area layout Availability Today area fields: Availability pie chart—Shows time duration percentages of the availability states for the FTP service today. The availability states include Available, Unavailable, Inaccessible, and Unmanaged. To view the time duration percentage of a specific availability state, place the cursor over the corresponding slice in the chart. Current Availability—Availability of the FTP service in the last polling period.
Figure 381 Connection Information area layout Connection Information area fields: Connection Time trend graph—Shows changes of the FTP connection time in the polling period over the last 1 hour. Hover the cursor over a spot on the curve to view the connection time at the specific time point. To change the report period, click the Last 1 Hour icon on the upper right of the graph, and then select an icon from the list.
Figure 382 File Information area layout File Information area fields: File Information trend graph—Shows the changes of files and directories in the home directory of the FTP account over the last 1 hour. The green curve shows the number of files and the orange curve shows the number of directories. Hover the cursor over a spot on the curve to view the number of files or directories at the specific time point.
Figure 383 Upload area layout Upload area fields: Average Uploading Rate trend graph—Shows changes of the average file uploading rate of the FTP application over the last 1 hour. Hover the cursor over a spot on the curve to view the average uploading rate at the specific time point. To change the report period, click the Last 1 Hour icon on the upper right of the graph, and then select an icon from the list.
Figure 384 Download area layout The Download area fields: Average Downloading Rate trend graph—Shows changes of the average file downloading rate of the FTP application over the last 1 hour. Hover the cursor over a spot on the curve to view the average downloading rate at the specific time point. To change the report period, click the Last 1 Hour icon on the upper right of the graph, and then select an icon from the list.
Figure 385 Application Traffic area layout Application Traffic area fields: Application Traffic trend graph—shows changes of inbound and outbound traffic over the last 1 hour. The green curve shows the inbound traffic and the orange shows the outbound traffic. To change the report period, click the Last 1 Hour icon on the upper right of the graph, and then select an icon from the list. Available options include Last 6 Hours , Today , Yesterday , This Week , This Month , and This Year .
Select Application Manager > Add Application from the navigation tree. The page displays all application types that can be monitored by APM. 3. Select Application Manager > Application Monitor from the navigation tree, and then click Add on the application monitor list page. Click SFTP Monitor of the Service Monitor class. The page for adding an SFTP service application monitor appears. 4.
parameter settings, and to determine whether to add the application monitor based on the verification result. APM adds the application monitor only when it can connect to the application. When this parameter is not selected, APM adds the application monitor without verifying the connection. 5. Click OK. Modifying an SFTP service application monitor Authorized users can modify all parameters except the IP address of an SFTP service application monitor.
5. Contact—Modify the contact information, such as name, email address, and telephone number. Related Applications—Modify the applications that the SFTP service depends on. Click Add, and then select applications in the popup Select Applications window. Operating system applications, such as Windows, AIX, FreeBSD, OpenBSD, HP-UX, Solaris, Mac OS, and Linux, cannot be selected.
Figure 387 Monitor Information area layout Monitor Information area fields: Name—Application monitor name. Health State—Health status of the SFTP service application. IP Address—IP address of the SFTP service host. Application Type—Type of the monitored application, which is always SFTP Monitor. Last Polling Time—Time when APM last polled the SFTP service.
Availability pie chart—Shows time duration percentages of the availability states for the SFTP service today. The availability states include Available, Unavailable, Inaccessible, and Unmanaged. To view the time duration percentage of a specific availability state, place the cursor over the corresponding slice in the chart. Current Availability—Availability of the SFTP service in the last polling period.
Login Time—Shows how long it takes APM to last successfully log in the SFTP server. History icon —Click the History icon to view the history connection time or login time changes in a line graph. Hover the cursor over a spot in the curve to view the connection time or login time values at the specific time point. Authorized users can view the data over the last 1 hour, last 6 hours, today, yesterday, this week, this month, and this year by clicking the corresponding icons.
the specific time point. Authorized users can view the data over the last 1 hour, last 6 hours, today, yesterday, this week, this month, and this year by clicking the corresponding icons. Upload When the upload function test is configured, APM uploads the selected test file and records the upload results after login to the SFTP server. The Upload area layout is shown in Figure 391.
Download When the download function test is configured, APM downloads the selected test file and records the download results after login to the SFTP server. The Download area layout is shown in Figure 392. Figure 392 Download area layout The Download area fields: Average Downloading Rate trend graph—Shows changes of the average file downloading rate of the SFTP application over the last 1 hour. Hover the cursor over a spot on the curve to view the average downloading rate at the specific time point.
Figure 393 Application Traffic area layout Application Traffic area fields: Application Traffic trend graph—shows changes of inbound and outbound traffic over the last 1 hour. The green curve shows the inbound traffic and the orange shows the outbound traffic. To change the report period, click the Last 1 Hour icon on the upper right of the graph, and then select an icon from the list. Available options include Last 6 Hours , Today , Yesterday , This Week , This Month , and This Year .
18 HTTP service monitor This chapter describes how to add and modify the URL application monitor, and helps you view the monitor report. URL A uniform resource locator (URL) provides a reference to an Internet resource and a means of locating the resource. For more information about URL, see RFC 1738. You can access resources provided by HTTP services through URLs. By accessing a URL, APM judges whether the HTTP service is properly running on the host that provides the resource to which the URL links.
4. Relative Path—Enter the relative path of the Web page, which starts with a slash (/). The URL of a Web page is in the format of http://++relative path, for example, http://10.154.240.55/imc/index.html, where the relative path is /imc/index.html. Contact—Enter user contact information, such as name, email address, and telephone number. The default is the username of the operator who created the application monitor.
selected. APM automatically adds the dependencies between URL and operating system applications by IP address and displays their dependencies in the application topology. To remove dependencies between URL and one or more applications, select the target applications in the Related Applications box and click Delete. 5. Detect Application—Select this parameter if you want to enable application detection.
Monitor Information Figure 395 Monitor Information area layout Monitor Information area fields: Name—Application monitor name. Health State—Health status of the URL. IP Address—IP address of the HTTP service host. Application Type—Type of the application, which is always URL. Port—Port number used to access the URL. The Web server provides HTTP services through the port. Last Polling Time—Time when APM last polled the URL application.
Figure 396 Availability Today area layout Availability Today area fields: Availability pie chart—Shows time duration percentages of the availability states for the URL today. The availability states include Available, Unavailable, Inaccessible, and Unmanaged. To view the time duration percentage of a specific availability state, place the cursor over the corresponding slice in the chart. Current Availability—Availability of the URL in the last polling period.
Figure 397 Response Time area layout Response Time area fields: URL response time trend graph—Shows changes of the round trip response time for the URL over the last 1 hour in a line chart. Hover the cursor over a spot on the curve to view the URL response time at the specific time point. To change the report period, click the Last 1 Hour icon on the upper right of the graph, and then select an icon from the list.
Figure 398 Page Size area layout Page Size area fields: Web page size trend graph—Shows changes of the Web page size over the last 1 hour in a line chart. Hover the cursor over a spot on the curve to view the Web page size at the specific time point. To change the report period, click the Last 1 Hour icon on the upper right of the graph, and then select an icon from the list. Available options include Last 6 Hours , Today , Yesterday , This Week , This Month , and This Year .
19 Middleware monitor APM supports monitoring the following application types: Office SharePoint WebSphere MQ This chapter describes how to add and modify the application monitors, and helps you view relevant monitor reports. Office SharePoint Office SharePoint is a set of enterprise business solutions developed by Microsoft.
start." APM automatically checks the specified IP address and associates the application monitor with the host managed in the IMC Platform. Name—Enter a unique application monitor name. HP recommends using Application name_host IP address for naming the application monitor. Description—Enter a description for the application monitor. Polling Interval (min)—Select a polling interval for the application monitor. Available options include 1, 2, 3, 4, 5, 10, 20, and 30.
Description—Modify a description for the application monitor. Polling Interval (min)—Select a polling interval for the application monitor. Available options include 1, 2, 3, 4, 5, 10, 20, and 30. The default polling interval is 5 minutes. A shorter polling interval provides more accurate real-time data, but consumes more system resources. Username—Modify the username of the administrator who is authorized to manage the host. If the administrator is a domain user, use domain name\username.
Figure 399 Part of an Office SharePoint application monitor report Monitor Information The Monitor Information area layout is shown in Figure 400. Figure 400 Monitor Information area layout Monitor Information area fields: Name—Application monitor name. Health State—Health status of the Office SharePoint application. IP Address—IP address of the Office SharePoint host. Application Type—Type of the monitored application, which is always Office SharePoint.
Figure 401 Availability Today area layout Availability Today area fields: Availability pie chart—Shows time duration percentages of the availability states for the Office SharePoint application today. The availability states include Available, Unavailable, Inaccessible, and Unmanaged. To view the time duration percentage of a specific availability state, hover the cursor over the corresponding slice in the chart.
Figure 402 CPU Usage Ratio—Dashboard area layout Figure 403 CPU Usage Ratio—Trend graph area layout CPU Usage Ratio area fields: CPU Usage Ratio dashboard or trend graph—View the area in a dashboard or a trend graph. Click the Dashboard icon or Trend icon on the top right corner to switch between the graphs. Dashboard graph—View the CPU usage ratio of the Office SharePoint application in the last APM polling period.
History icon —Click the History icon to view the history graph of the CPU usage ratio trend. Hover the cursor over a spot on the curve to view the CPU usage ratio at the specific time point. Authorized users can view CPU usage ratio statistics over the last 1 hour, last 6 hours, today, yesterday, this week, this month, and this year by clicking the corresponding icons on the upper right of the graph. Memory Status The Memory Status area layout is shown in Figure 404.
Excel Calculation Services The Excel Calculation Services area layout is shown in Figure 405. Figure 405 Excel Calculation Services area layout Excel Calculation Services area fields: Excel Calculation Services trend graph—Shows changes of sessions opened per second in Excel calculation services and active requests received per second by Excel calculation services over the last 1 hour. Hover the cursor over a spot on the curve to view the number of sessions or requests at the specific time point.
History icon —Click the History icon to view the history trend graph of the corresponding index. Hover the cursor over a spot on the curve to view the monitor data at the specific time point. Authorized users can view statistics over the last 1 hour, last 6 hours, today, yesterday, this week, this month, and this year by clicking the corresponding icons on the upper right of the graph. Office Search Collector The Office Search Collector area layout is shown in Figure 406.
Delayed Documents—Number of documents delayed to be searched by the Office search collector subject to site hit frequency rules. Retried Documents—Number of documents that will be retried after timeout. Active Queue Length—Number of documents waiting for robot threads in the Office search collector. Server Objects—Number of servers accessed by the Office search collector during a crawl. Office SharePoint creates a server object for a server being accessed for the first time.
Requests/Sec—Number of requests received per second by Excel calculation services. History icon —Click the History icon to view the history trend graph of the corresponding index. Hover the cursor over a spot on the curve to view the monitor data at the specific time point. Authorized users can view statistics over the last 1 hour, last 6 hours, today, yesterday, this week, this month, and this year by clicking the corresponding icons on the upper right of the graph.
Active Server Pages The Active Server Pages area layout is shown in Figure 409. Figure 409 Active Server Pages area layout Active Server Pages area fields: Active Server Pages trend graph—Shows changes of Active Server Pages (ASP) statistics over the last 1 hour. Hover the cursor over a spot on the curve to view the monitor data at the specific time point. To change the report period, click the Last 1 Hour icon on the upper right of the graph, and then select an icon from the list.
Document Conversion The Document Conversion area layout is shown in Figure 410. Figure 410 Document Conversion area layout Document Conversion area fields: Active Server Pages trend graph—Shows changes of pending sessions and email message processing rate over the last 1 hour. Hover the cursor over a spot on the curve to view the monitor data at the specific time point. To change the report period, click the Last 1 Hour icon on the upper right of the graph, and then select an icon from the list.
Display Name—Display name of the service, and is equivalent to the alias of the service. The Window service console shows display names of services. In most cases, the display name of a service differs from the original name. Status—Status of the service when APM last polled Office SharePoint. Office Search Archive Plugin The Office Search Archive Plugin area layout is shown in Figure 411. The data was obtained when APM last polled Office SharePoint.
Copied Alias—Number of aliases ignored because of duplication. Error Documents—Number of error documents returned by the Office search plan plugin. Updates—Times of alias updates by the Office search plan plugin. Total Documents—Number of documents processed by the Office search plan plugin. Total Properties Processed—Number of properties processed by the Office search plan plugin. Office Server Search Index The Office Server Search Index area layout is shown in Figure 414.
WebSphere MQ WebSphere MQ is a message-oriented middleware launched by IBM to provide unified and reliable methods for communication between different applications. It is available on a large number of platforms, including Unix, Linux, Windows, OS/2, and AS/400. APM can monitor WebSphere MQ 6.0. This section describes how to add and modify a WebSphere MQ application monitor, and helps you view the monitor report.
5. Contact—Enter user contact information, such as name, email address, and telephone number. The default is the username of the operator who created the application monitor. Related Applications—Configure the applications that WebSphere MQ depends on. Click Add, and then select applications in the popup Select Applications window. Operating system applications, such as Windows, AIX, FreeBSD, OpenBSD, HP-UX, Solaris, Mac OS, and Linux, cannot be selected.
applications, such as Windows, AIX, FreeBSD, OpenBSD, HP-UX, Solaris, Mac OS, and Linux, cannot be selected. APM automatically adds the dependencies between WebSphere MQ and operating system applications by IP address and displays their dependencies in the application topology. To remove dependencies between WebSphere MQ and one or more applications, select the target applications in the Related Applications box and click Delete. 5.
Figure 417 Monitor Information area layout Monitor Information area fields: Name—Application monitor name. Health State—Health status of the WebSphere MQ application. IP Address—IP address of the WebSphere MQ host. Application Type—Type of the monitored application, which is always WebSphere MQ. Last Polling Time—Time when APM last polled WebSphere MQ.
Availability pie chart—Shows time duration percentages of the availability states for the WebSphere MQ application today. The availability states include Available, Unavailable, Inaccessible, and Unmanaged. To view the time duration percentage of a specific availability state, hover the cursor over the corresponding slice in the chart. Current Availability—Availability of the WebSphere MQ application in the last APM polling period.
The data is highlighted in orange when the response time reaches the level-1 threshold, and is highlighted in red when the response time reaches the level-2 threshold. Use the global thresholds or custom thresholds. For information about setting the thresholds, see "Threshold Management." History icon —Click the History icon to view the history graph of the response time trend. Hover the cursor over a spot on the curve to view the response time at the specific time point.
Figure 421 Queue area layout Queue area fields: Name—Name of the queue managed by WebSphere MQ. Current Queue Depth—Number of messages stored in the queue. Outstanding Inputs—Number of messages being added to the queue. Outstanding Outputs—Number of messages being taken from the queue. Max. Queue Depth—Maximum number of messages allowed to be stored in the queue. More—Click More to view all queues. Channel The Channel area layout is shown in Figure 422.
Name—Name of the listener managed by WebSphere MQ. State—Status of the listener when APM last polled WebSphere MQ. Session Count—Number of sessions between the listener and its clients when APM last polled WebSphere MQ. Max. Concurrent Connections—Maximum number of concurrent connections supported by the listener. Connections exceeding the limit cannot be established. Port—TCP port on which the listener listens.
20 SAP monitor APM provides the ability to monitor the availability and performance of SAP R/3 Release 4.6C (RedHat version) to promptly detect bottlenecks in SAP applications. Prerequisites Before you can monitor SAP in APM, complete the tasks for IMC as described in this section. If IMC is installed on a Windows server, complete the following provisioning task: 1. Download SAP JavaConnector [sapjco-ntintel-2.1.8] from http://service.sap.com/connectors. 2.
The page displays all application types that can be monitored by APM. 3. Select Application Manager > Application Monitor from the navigation tree, and then click Add on the application monitor list page. Click SAP of the SAP Monitor class. The page for adding a SAP application monitor appears. 4. Configure the following parameters: Name—Enter a unique application monitor name. HP recommends using Application name_host IP address for naming the application monitor.
2. Select Application Manager > Application Monitor from the navigation tree. The application monitor list page appears. 3. Click the Modify icon for the SAP application monitor you want to modify. The page for modifying the SAP application monitor appears. 4. Modify the following parameters for the application monitor: Name—Modify the unique application monitor name. HP recommends using Application name_host IP address for naming the application monitor.
The SAP monitor report appears, as shown in Figure 30. For information about the icons in the monitor report, see "2 Quick start." The page has the following tabs: Overview OS Background Dialog Buffer Spool This section describes the fields on each tab of the monitor report. Figure 424 Part of a SAP application monitor report Monitor Information The Monitor Information area is located on the Overview tab and its layout is shown in Figure 31.
IP Address—IP address of the SAP host. Application Type—Type of the monitored application, which is always SAP. Client—Number of the SAP client. System Instance—Instance number of the SAP application. Language—Language code of the SAP application. Last Polling Time—Time when APM last polled the SAP application. Relationship icon —Click the Relationship icon to view dependencies between the SAP application and other applications in a dependency topology view.
Unavailable Time—Total unavailable time duration of the SAP application since 00:00 today. Inaccessible Time—Total inaccessible time duration of the SAP application since 00:00 today. Unmanaged Time—Total unmanaged time duration of the SAP application since 00:00 today. Availability time statistics of a new application monitor are collected since the application monitor was added. An availability time field does not appear if its value is 0.
Figure 428 Spool Process Usage area layout Spool Process Usage area fields: Trend graph—Shows the changes of the spool process usage for the SAP application in a line chart. Hover the cursor over a spot on the curve to view the spool process usage at the specific time point. View the changes of the spool process usage over a specified time period by clicking the Last 1 hour icon , Last 6 hours icon , Today icon , Yesterday icon , This Week icon , This Month icon , or This Year icon .
, This Week icon data by default. , This Month icon , or This Year icon . The graph shows the last hour Attribute/Value—Monitor index name and data. Background Processing Usage—Percentage of the active background processes to the total background processes when APM last polled SAP. History icon —Click the History icon to view the history trend graph of the background processing usage. Hover the cursor over a spot on the curve to view data at the specific time point.
Figure 431 Memory Page Dispatcher area layout Memory Page Dispatcher area fields: Trend graph—Shows the changes of memory swap-in and swap-out rates on the SAP host in a line chart. The green curve shows pages swapped in per second and the orange curve shows the pages swapped out per second. Hover the cursor over a spot on a curve to view data at the specific time point.
Figure 432 Disk Space Usage area layout Disk Space Usage area fields: Trend graph—Shows the changes of the disk space usage on the SAP host in a line chart. Hover the cursor over a spot on the curve to view the disk space usage at the specific time point. View the changes of the disk space usage over a specified time period by clicking the Last 1 hour icon , Last 6 hours icon , Today icon , Yesterday icon , This Week icon , This Month icon , or This Year icon .
hours icon , Today icon , Yesterday icon , This Week icon This Year icon . The graph shows the last hour data by default. , This Month icon , or Attribute/Value—Monitor index name and data. Pending Background Processes—Number of pending background processes in the SAP application when it was last polled by APM. Background Processing Terminations The Background Processing Terminations area is located on the Background tab and its layout is shown in Figure 434.
Figure 435 Background Processing Errors area layout Background Processing Errors area fields: Trend graph—Shows the changes of the background processing error rate of the SAP application in a line chart. Hover the cursor over a spot on the curve to view the background processing error rate at the specific time point.
Trend graph—Shows the changes in the number of idle SAP processes in a line chart. Hover the cursor over a spot on the curve to view the number of idle SAP processes at the specific time point. View the changes in the number of idle SAP processes over a specified time period by clicking the Last 1 Hour icon , Last 6 Hours , Today , Yesterday , This Week , This Month , or This Year . The graph shows the last hour data by default.
Standardization Response Time The Standardization Response Time area is located on the Dialog tab and its layout is shown in Figure 438. Figure 438 Standardization Response Time area layout Standardization Response Time area fields: Trend graph—Shows the changes of the standardization response time for the SAP application in a line chart. Hover the cursor over a spot on the curve to view the standardization response time at the specific time point.
Figure 439 Login User area layout Login User area fields: Trend graph—Shows the changes in the number of users logged in SAP in a line chart. Hover the cursor over a spot on the curve to view the number of login SAP users at the specific time point. View the changes in the number of login SAP users over a specified time period by clicking the Last 1 hour icon , Last 6 hours icon , Today icon , Yesterday icon , This Week icon , This Month icon , or This Year icon .
Swap Frequency—Number of swaps that occur in the buffer per minute due to full buffer. The data was obtained when APM last polled SAP. Hit Ratio—Percentage of database queries that were found in the buffer instead of being sent to the database. The data was obtained when APM last polled SAP. History icon —Click the History icon to view the history trend graph of the index. Hover the cursor over a spot on the curve to view data at the specific time point.
Figure 442 Request Queue Usage area layout Request Queue Usage area fields: Trend graph—Shows the changes of the spool request queue usage for the SAP application in a line chart. Hover the cursor over a spot on the curve to view the spool request queue usage at the specific time point. View the changes of the spool request queue usage over a specified time period by clicking the Last 1 hour icon , Last 6 hours icon , Today icon , Yesterday icon , This Week icon , This Month icon , or This Year icon .
Figure 443 Spool Work Statistics area layout Spool Work Statistics area fields: Trend graph—Shows the changes of the spool error rate of the SAP application in a line chart. Hover the cursor over a spot on the curve to view the spool error rate at the specific time point. View the changes of the spool error rate over a specified time period by clicking the Last 1 Hour icon , Last 6 Hours , Today , Yesterday , This Week , This Month , or This Year . The graph shows the last hour data by default.
Figure 444 Device Cache area layout Device Cache area fields: Trend graph—Shows the changes of the device cache usage of the SAP application in a line chart. Hover the cursor over a spot on the curve to view the device cache usage at the specific time point. View the changes of the device cache usage over a specified time period by clicking the Last 1 Hour icon , Last 6 Hours , Today , Yesterday , This Week , This Month , or This Year . The graph shows the last hour data by default.
Host Spool List area fields: Trend graph—Shows the changes of the space usage in the host spool list of the SAP application in a line chart. Hover the cursor over a spot on the curve to view the space usage in the host spool list at the specific time point. View the changes of the space usage in the host spool list over a specified time period by clicking the Last 1 Hour icon , Last 6 Hours , Today , Yesterday , This Week , This Month , or This Year . The graph shows the last hour data by default.
21 Configuration examples The chapter provides two configuration examples for using APM to monitor applications on a network: In configuration example 1, a small Internet data center website is deployed with Linux, Apache, MySQL, and PHP servers. Users can access the WWW service at the website. In configuration example 2, a corporate data center is deployed to use Microsoft technologies including DNS, IIS, Active Directory, Exchange, .NET, and SQL Server.
FTP—FTP server deployed VSFTP. It receives backup data from MySQL-S every day. SW1—Layer 3 switch that provides network access services and performs access control for all servers. Administrators required for the network include: Administrator A—Performs routine network maintenance. As a member of the operator group Administrator Group, administrator A has the Admin privilege and manages all servers, network devices, BIND, and VSFTP. Administrator B—Updates and publishes web pages.
FTP username/password—apm/apm123 3. Add the switch and the servers to the IMC platform. You can view detailed information about the switch and servers on the IMC platform. 4. Add the following application monitors: 5. Linux monitor. Apache server monitor. MySQL monitor. PHP monitor. DNS monitor. FTP monitor. Directory monitor. Database query monitor. URL monitor. Add application groups as shown in Table 8.
Figure 447 Application topology Table 9 Application topology Server Application monitor Application type Dependency Gen1_192.168.10.10 Linux None FTP_192.168.10.10 FTP service Depends on Linux FTP DNS Depends on: Dir_192.168.10.10 Directory Linux FTP Gen2_192.168.10.20 Linux None DNS_192.168.10.20 DNS service Depends on Linux MySQL-M_192.168.20.10 Linux None MySQL_192.168.20.10 MySQL Depends on Linux Depends on: MySQL-M DBQ_192.168.20.10 Database query MySQL-S_192.168.20.
Server Application monitor Application type Dependency Web1_192.168.30.10 Linux None Apache_192.168.30.10 Apache server Depends on Linux PHP_192.168.30.10 PHP Depends on: Web1 Linux Apache server Depends on: Linux Apache server PHP URL_192.168.30.10 URL Web1_192.168.30.20 Linux None Apache_192.168.30.20 Apache server Depends on Linux Depends on: PHP_192.168.30.20 PHP Web2 Linux Apache server Depends on: URL_192.168.30.
Figure 448 Network diagram This network comprises the following devices (all hosts are running Windows Server 2003): DC-M/DC-S—Primary and secondary DCs in domain apm-test.com. DNS service is integrated on DC-M. EX-1/EX-2/EX-3—Mail servers running Exchange Server 2007. EX-1 and EX-2 belong to domain apm-test.com. EX-3 does not belong to any domain. EX-1—Deployed with the hub transport role, client access role, and mailbox role. EX-2—Deployed with the unified messaging server role.
Administrator D—Responsible for office service management and maintenance. As a member of the operator group Office Group, administrator D has the maintainer privilege and manages servers File, OA, and SQL Server. Configuration consideration You can configure APM to monitor the following applications in the network: Windows Server applications on the eight hosts.
Application group Application Operator group Privilege Email Group Maintainer Office Group Maintainer Exchange Server 2007 on EX-1, EX-2, and EX-3 Group C IIS server on EX-1 .NET server on EX-1 Windows Server on EX-1, EX-2, and EX-3 Group D 4. Three directories on File SQL Server on SQL IIS server on OA .NET server on OA An operator of the Administrator Group can view the application topology after logging in to IMC. See Figure 449.
Server Application monitor Application type Dependency Depends on: EX2007_192.168.30.10 Exchange Server 2007 Windows Server IIS server .NET server Active Directory Exchange Server 2007 (unified messaging) Exchange Server 2007 (edge transport) EX-2 EX-3 DC-M EX2_192.168.30.20 Windows Server None EX2007_192.168.30.20 Exchange Server 2007 Depends on Windows Server EX2_192.168.30.30 Windows Server None EX2007_192.168.30.
22 Support and other resources Contacting HP For worldwide technical support information, see the HP support website: http://www.hp.
Conventions This section describes the conventions used in this documentation set. Command conventions Convention Description Boldface Bold text represents commands and keywords that you enter literally as shown. Italic Italic text represents arguments that you replace with actual values. GUI conventions Convention Description Boldface Window names, button names, field names, and menu items are in bold text. For example, the New User window appears; click OK.
Index ACDEFGHIJLMNOPQRSTUVW Adding an application monitor,19 A Adding an application monitor through Auto Discovery,8 Active Directory service,392 Adding a .
Configuration procedure,521 J Configuration procedure,526 JavaRuntime,441 Configuring JavaRuntime to support RMI access,441 JBoss server,256 Configuring the Apache server,315 L Configuring the JBoss server,257 Configuring the Oracle Application Server,276 LDAP service,405 Configuring the Tomcat server to support JMX monitoring,266 M Linux,164 Contacting HP,529 Mac OS,117 Conventions,530 Modifying a .
Modifying an Apache server application monitor,317 Related information,529 Modifying an application group,35 RESTful Web service,379 Modifying an application monitor,19 S Modifying an Exchange Server 2003 application monitor,341 Setting the custom thresholds,40 Setting the filter conditions,48 Modifying an Exchange Server 2007 application monitor,354 Setting the management status of an application monitor,20 Modifying an FTP service application monitor,452 Setting the refresh interval,49 Modifyi
Viewing the AIX application monitor report,75 Viewing the POP3 application monitor report,368 Viewing the Apache server application monitor report,317 Viewing the probe details,44 Viewing the application default port list,42 Viewing the application group details,34 Viewing the RESTful Web service application monitor report,381 Viewing the application group list,33 Viewing the SAP application monitor report,502 Viewing the application monitor list,16 Viewing the application topology,27 Viewing the S