
HP Intelligent Management Center v5.2 Application Performance Manager Administrator Guide

92
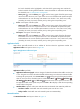
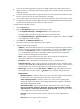
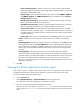
Figure 45 Part of a Solaris application monitor report
Monitor Information
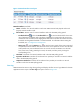
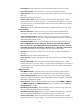
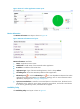
The Monitor Information area layout is shown in Figure 46.
Figure 46 Monitor Information area layout
Monitor Information area fields:
Name—Application monitor name.
Health State—Health status of the monitored Solaris application.
IP Address—IP address of the Solaris host.
Application Type—Type of the monitored application, which is always Solaris.
Last Polling Time—Time when APM last polled the Solaris application.
Relationship icon —Click the Relationship icon to view dependencies between the Solaris
application and other applications in a dependency topology view. For more information about
dependency topologies, see "Topology management."
Top5 Unrecovered Alarms—Latest five unrecovered alarms on the Solaris host. The alarm level is
identified by color: yellow for minor alarms, orange for major alarms, and red for critical alarms.
If no alarm is generated by Solaris, this field does not appear.
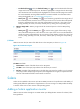
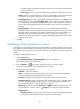
Availability Today
The Availability Today area layout is shown in Figure 47.