
HP Intelligent Management Center v5.2 Application Performance Manager Administrator Guide

100
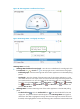
Yesterday , This Week , This Month , and This Year . Hover the cursor over a spot on
the curve to view the application traffic at the specific time point. Click Rx or Tx to display or hide
the corresponding monitor index in the graph.
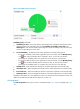
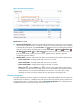
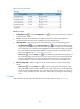
Attribute/Value—Monitor index name and data that was obtained when APM last polled Solaris.
Last Hour's Traffic—Total traffic sent and received by Solaris over the last 1 hour.
Today's Traffic—Total traffic sent and received by Solaris since 00:00 today.
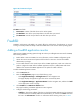
Network Interface
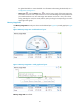
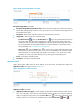
The Network Interface area layout is shown in Figure 56.
Figure 56 Network Interface area layout
Network Interface area fields:
Name—Identifier of a network interface card in Solaris. APM monitors both physical and virtual
(logical) network interface cards.
Receive Rate—Receive rate of a network interface card in the last APM polling period.
Set Threshold icon —Click the Set Threshold icon to set alarm thresholds for the receive
rate of Solaris network interface cards. The data is highlighted in orange when it the receive
rate reaches the level-1 threshold, and is highlighted in red when the receive rate reaches the
level-2 threshold. Use the global thresholds or custom thresholds. For information about setting
the thresholds, see "5 Configuration management."
History icon —Click the History icon to view the history graph of the receive rate trend
of a specified network interface card. Hover the cursor over a spot on the curve to view the data
at the specific time point. Authorized users can view the receive rate statistics over the last 1
hour, last 6 hours, today, yesterday, this week, this month, and this year by clicking the
corresponding icons.
Send Rate—Send rate of a network interface card in the last APM polling period.
Input Error Packet Loss—Number of lost inbound error packets per second on a network interface
card in the last APM polling period.
Output Error Packet Loss—Number of lost outbound error packets per second on a network
interface card in the last APM polling period.
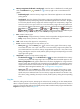
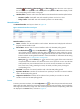
Process
To monitor processes on Solaris, click the Configuration icon to select the processes to be monitored.
APM collects the index data for the monitored processes during the next host polling, which includes the
CPU usage ratio and memory usage ratio. The monitored processes and the corresponding index data
are displayed in the Process area, as shown in Figure 57.