
HP Intelligent Management Center v5.2 Application Performance Manager Administrator Guide

142
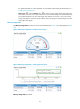
Memory Usage Ratio dashboard or trend graph—View the area in a dashboard or a trend graph.
Click the Dashboard icon or Trend icon on the top right corner to switch between the
graphs.
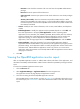
Dashboard graph—View the memory usage ratio of the OpenBSD application in the last APM
polling period.
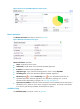
Trend graph—View the changes of the memory usage ratio (including the physical memory
usage ratio and swap memory usage ratio) for the OpenBSD application in a line chart. The
green line is for the physical memory usage ratio and the orange for the swap memory usage
ratio. Hover the cursor over a spot on the curve to view the memory usage ratio at the specific
time point. View the changes of the memory usage ratio over a specified time period by clicking
the Last 1 hour icon , Last 6 hours icon , Today icon , Yesterday icon , This Week
icon , This Month icon , and This Year icon . Click the legend names of the different
types of memory usage ratio to display or hide the corresponding monitor indexes.
Item—Monitor memory type.
Physical memory—Physical memory of OpenBSD, which corresponds to the physical memory
bar.
Swap—Swap memory of OpenBSD, which corresponds to the disk space.
Total—Total amount of the physical or swap memory.
In Use—Amount of the physical or swap memory in use.
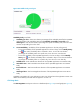
History icon —Click the History icon to view the history graph of the memory usage
trend. Place the cursor over a spot in the curve to view the memory usage at the specific time
point. Authorized users can view the memory usage statistics over the last 1 hour, last 6 hours,
today, yesterday, this week, this month, and this year by clicking the corresponding icons on the
upper right of the graph.
Usage Ratio—Physical or swap memory usage ratio.
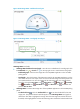
Set Threshold icon —Click the Set Threshold icon to set alarm thresholds for the memory
(including the physical and swap) usage ratio. The specified alarm thresholds appear on the
Memory Usage Ratio trend graph as dotted lines. The data is highlighted in orange when the
memory usage ratio reaches the level-1 threshold, and is highlighted in red when the memory
usage ratio reaches the level-2 threshold. Use the global thresholds or custom thresholds. For
information about setting the thresholds, see "5 Configuration management."
History icon —Click the History icon to view the history graph of the memory usage
ratio trend. Hover the cursor over a spot on the curve to view the memory usage ratio at the
specific time point. Authorized users can view memory usage ratio statistics over the last 1 hour,
last 6 hours, today, yesterday, this week, this month, and this year by clicking the corresponding
icons.
Ping Test
When the polling interval expires, APM pings the OpenBSD host by sending up to three ICMP packets.
When a response packet is received, the ping succeeds and APM records the response time. When it
receives no response after sending out all ICMP packets, APM considers that the ping test has failed. The
Ping Test area layout is shown in Figure 94.