
HP Intelligent Management Center v5.2 Application Performance Manager Administrator Guide

153
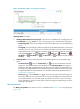
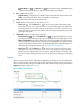
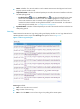
Figure 102 Monitor Information area layout
Monitor Information area fields:
Name—Application monitor name.
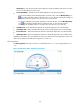
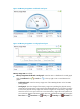
Health State—Health status of the monitored HP-UX application.
IP Address—IP address of the HP-UX host.
Application Type—Type of the monitored application, which is always HP-UX.
Last Polling Time—Time when APM last polled the HP-UX application.
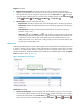
Relationship icon —Click the Relationship icon to view dependencies between the HP-UX
application and other applications in a dependency topology view. For more information about
dependency topologies, see "Topology management."
Top5 Unrecovered Alarms—Latest five unrecovered alarms on the HP-UX host. The alarm level is
identified by color: yellow for minor alarms, orange for major alarms, and red for critical alarms.
If no alarm is generated by HP-UX, this field does not appear.
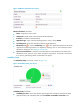
Availability Today
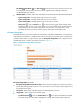
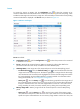
The Availability Today area layout is shown in Figure 103.
Figure 103 Available Today area layout
Availability Today area fields:
Availability pie chart—Shows time duration percentages of the availability states for the HP-UX
application today. The availability states include Available, Unavailable, Inaccessible, and